The Zig-Zag indicator attempts to determine price trends, support and resistance areas, and classic chart patterns like head and shoulders, double bottoms and double tops.
The Zig-Zag indicator is commonly used in Elliot Waves counting.
The Zig-Zag indicators uses both swing highs and swing lows in its calculation:
The Zig-Zag indicator can use both percentages or points in its construction. To construct the Zig-Zag indicator, there must be a certain percentage or number of points between a swing high and a swing low before a line will be drawn.
The ZigZag is based on the chart “type.” Line and dot charts, which are based on the close, will show the ZigZag based on closing prices. High-Low-Close bars (HLC), Open-High-Low-Close (OHLC) bars and candlesticks, which show the period’s high-low range, will show the ZigZag based on this high-low range.
A ZigZag based on the high-low range is more likely to change course than a ZigZag based on the close because the high-low range will be much larger and produce bigger swings.
The parameters box allows chartists to set the sensitivity of the ZigZag feature. A ZigZag with 5 in the parameter box will filter out all movements less than 5%.
A ZigZag(10) will filter out movements less than 10%.
If a stock traded from a reaction low of 100 to a high of 109 (+9%), there would not be a line because the move was less than 10%.
If the stock advanced from a low of 100 to a high of 110 (+10%), there would be a line from 100 to 110.
If the stock continued on to 112, this line would extend to 112 (100 to 112). The ZigZag would not reverse until the stock declined 10% or more from its high.
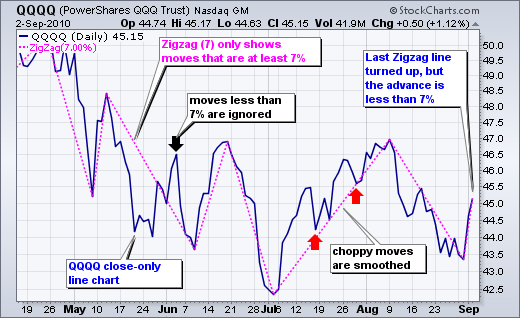
From a high of 112, a stock would have to decline 11.2 points (or to a low of 100.8) to warrant another line. The chart below shows a QQQQ line chart with a 7% ZigZag. The early June bounce was ignored because it was less than 7% (black arrow).
The two pullbacks in July were ignored because they were much less than 7% (red arrows).
Be careful with the last ZigZag line. Astute chartists will notice that the last ZigZag line is up even though QQQQ advanced just 4.13% (43.36 to 45.15). This is just a temporary line because QQQQ has yet to reach the 7% change threshold.
A move to 46.40 is needed for a gain of 7%, which would then warrant a permanent ZigZag line. Should QQQQ fail to reach the 7% threshold on this bounce and then decline below 43, this temporary line would disappear and the prior ZigZag line would continue from the early August high.
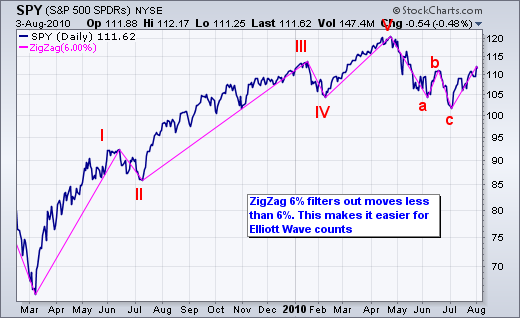
The ZigZag feature can be used to filter out small moves and make Elliott Wave counts more straight-forward. The chart below shows the S&P 500 ETF with a 6% ZigZag to filter moves less than 6%.
After a little trial and error, 6% was deemed the threshold of importance. An advance or decline greater than 6% was deemed significant enough to warrant a wave for an Elliott count.
Keep in mind that this is just an example. The threshold and the wave count are subjective and dependent on individual preferences.
Based on the 6% ZigZag, a complete cycle was identified from March 2009 until July 2010. A complete cycle consists of 8 waves, 5 up and 3 down.
Sharpcharts users can choose between the normal “ZigZag” and “ZigZag (Retrace.).” As shown in the examples above, the normal ZigZag shows lines that move at least a specific percentage.
The ZigZag (Retrace.) connects the reaction highs and lows with labels that measure the prior move. The numbers on the dotted lines reflect the difference between the current Zigzag line and the ZigZag line immediately before it.
For example, the chart below shows Altera (ALTR) with the 15% ZigZag (Retrace.) feature. Three ZigZag lines have been labeled (1, 2 and 3). The dotted line connecting the low of Line 1 with the low of Line 2 shows a box with 0.638.
This means Line 2 is .638 (63.8%) of Line 1. A number below 1 means the line is shorter than the prior line.
The dotted line connecting the high of Line 2 with the high of Line 3 shows a box with 1.646.
This means Line 3 is 1.646 (164.6%) of Line 2. A number above 1 means the line is longer than the prior line.
As you may have guessed, seeing these lines as a percentage of the prior lines makes it possible to assess Fibonacci retracements and Fibonacci projections. The August decline (Line 2) retraced around 61.8% of the June-July advance (Line 1).
This is a classic Fibonacci retracement. The advance from early September to early November was 1.646 times the August decline.
In this sense, the ZigZag (Retrace.) can be used to project the length of an advance. Again, 1.646 is close to the Fibonacci 1.618, which is the Golden Ratio used in many projection estimates. See our ChartSchool article for more on Fibonacci retracements.
The ZigZag and ZigZag (Retrace.) filter price action and do not have any predictive power. The ZigZag lines simply react when prices move a certain percentage.
Chartists can apply an array of technical analysis tools to the ZigZag. Chartists can perform basic trend analysis by comparing reaction highs and lows.
Chartists can also overlay the ZigZag feature to look for price patterns that might not be as visible on a normal bar or line chart.
The ZigZag has a way of highlighting the important movements and ignoring the noise. When using the ZigZag feature, don’t forget to measure the last line to determine if it is temporary or permanent.
The last ZigZag line is temporary if the current price change is less than the ZigZag parameter.
The last line is permanent when the price change is greater than or equal to the ZigZag parameter.
Source: StockCharts | https://commodity.com/
Hi Traders! Arvinth here from the Home Trader Club team. The weekly summary and, review of July…
The Japanese yen surged on Thursday, in a move analysts said bore the hallmarks of…
Hi Traders! EURAUD short term forecast and technical analysis is here. We do our analysis…
Hi Traders! NZDCAD short term forecast update and follow up is here. On June 2nd,…
Hi Traders! NZDCHF short term forecast and technical analysis is here. We do our analysis…
Hi Traders! AUDUSD short term forecast follow-up and update is here. On May 27th 2026…
View Comments
So in forex would you say that your using zig zag to identify cycles an what settings should you use?
Hi Jason
I use my eyes, as I do that many years now. But for beginner, zigzag can help. Settings are good on default, and may increase if you need to measure bigger cycles.
great article
Thank you!
ZigZag is an amazing indicator which if applied correctly can generate great profits!
ZigZag Indicator, very interesting article. Thank you so much for sharing.
Informative article Vlad, thank you so much
Thanks for the ultimate guide. Very useful