Hi Traders! Arvinth here from the Home Trader Club team. The weekly summary and, review of April 26th 2024 is here. It is now time to recap and summarize the trade setups that we had during this week. Below you will find a short explanation of all the trade setups we had this week and how it has currently developed now.
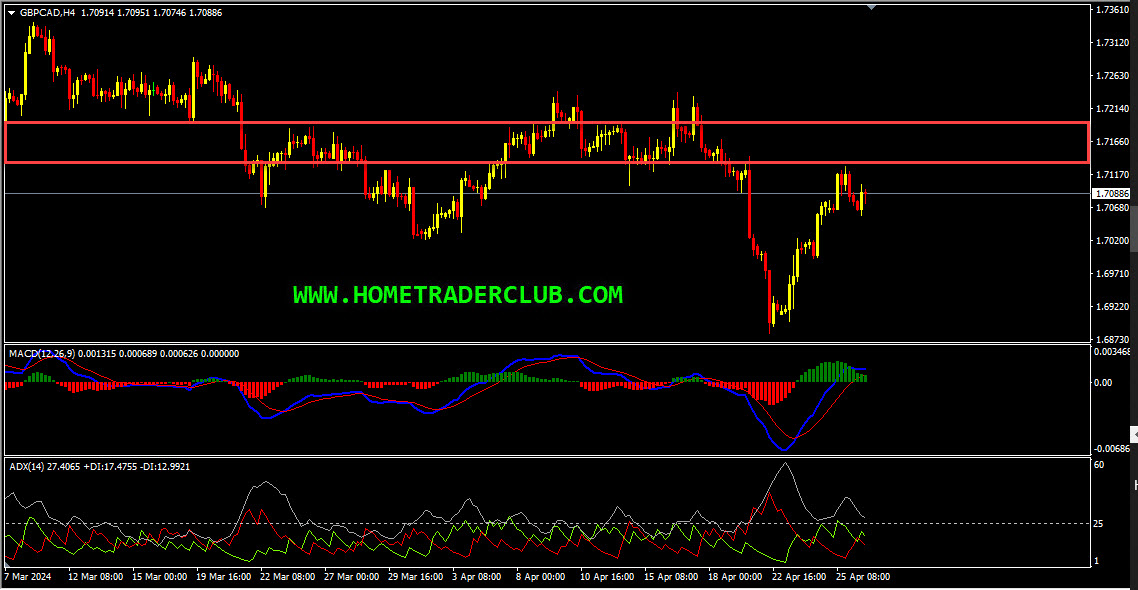
GBPCAD – My idea here was “On the H4 chart, based on the Heikin Ashi candles we can see that currently, we have strong bearish bodies in downward moving market conditions so it basically reflects a bearish environment. In addition to this, the price which is moving lower has created a bearish trend pattern in the form of three lower highs, lower lows which we may consider as evidence of bearish pressure. Generally, after a bearish trend pattern, we may expect corrections and then further continuation lower. Also, the price which is moving lower has created lower lows based on the MACD indicator, which is another sign of gaining momentum toward the bearish side. In addition to this, the ADX indicator gave a bearish signal here at the cross of -DI (red line) versus +DI (green line) and the main signal line (silver line) reads a value over 25 which we may consider as yet another evidence of bearish pressure. So everything looks good here for the bears and until this strong resistance zone (marked in red) shown in the image below holds my short term view remains bearish here and I expect the price to move lower further after pullbacks”.
Current Scenario – My plan still remains the same in GBPCAD, that is until the strong resistance zone holds my short term view remains bearish here and I expect the price to move lower further after pullbacks.
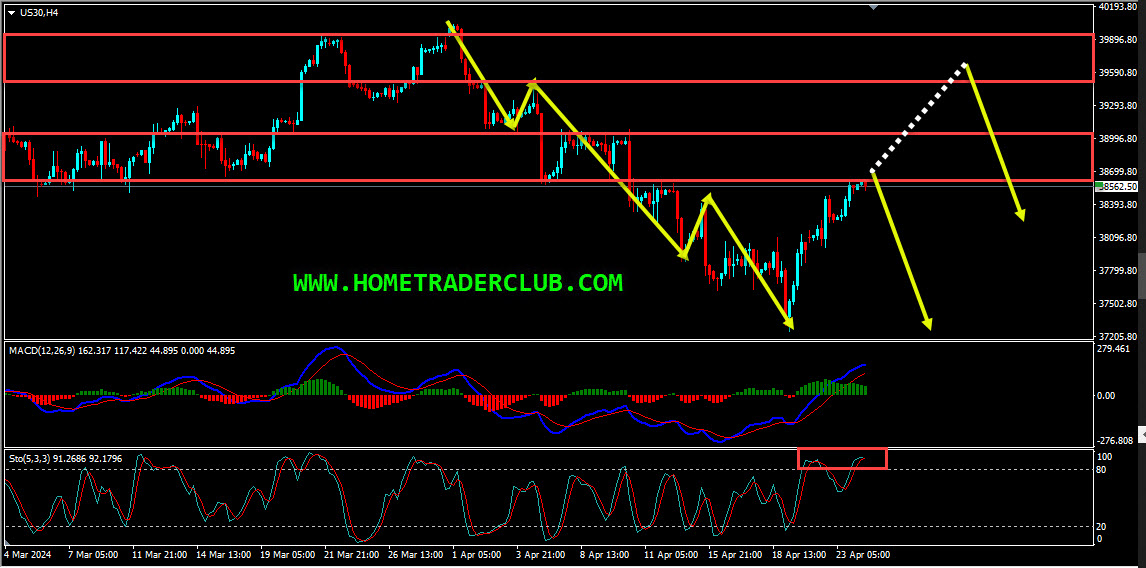
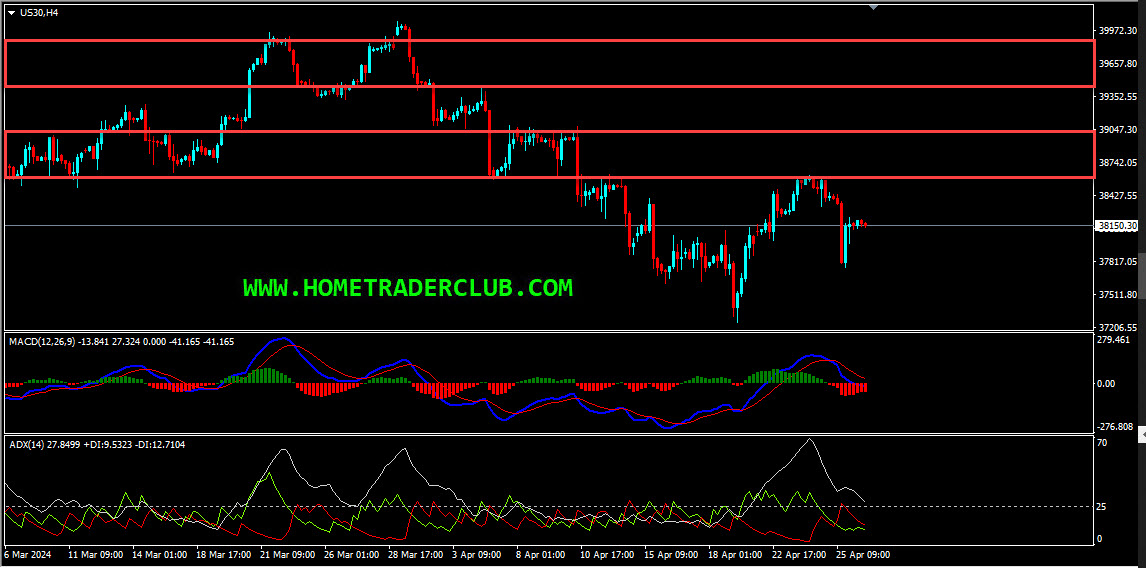
Dow Jones – My idea here was “On the H4 chart, the price which is moving lower has created a bearish trend pattern in the form of three lower highs, lower lows which we may consider as evidence of bearish pressure. Generally, after a bearish trend pattern, we may expect corrections and then further continuation lower. Currently it looks like a correction is happening and also based on the Stochastic Oscillator we could see that the price has reached its extreme which we mat consider as another evidence of bearish pressure. Also, we had two strong support zones that has formed and the price which is moving lower has broken below these zones and is holding below them, we may consider this as yet another evidence of bearish pressure. Currently, these strong support zones are acting as strong resistance zones for us. Until these two strong resistance zones (marked in red) shown in the image below hold my view remains bearish here and I expect the price to move lower further”.
Current Scenario – In Dow Jones, the price action is following the bearish expectations so far. My plan didn’t change here, that is, I expect the price to move lower further in the short term after pullbacks until the two strong resistance zones (marked in red) shown in the image below holds.
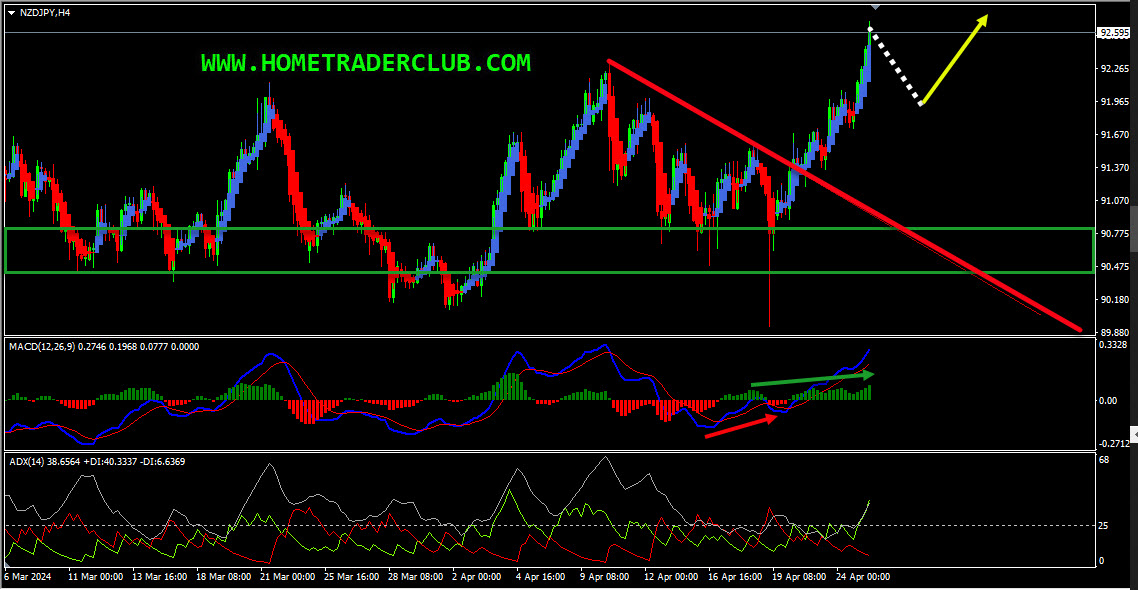
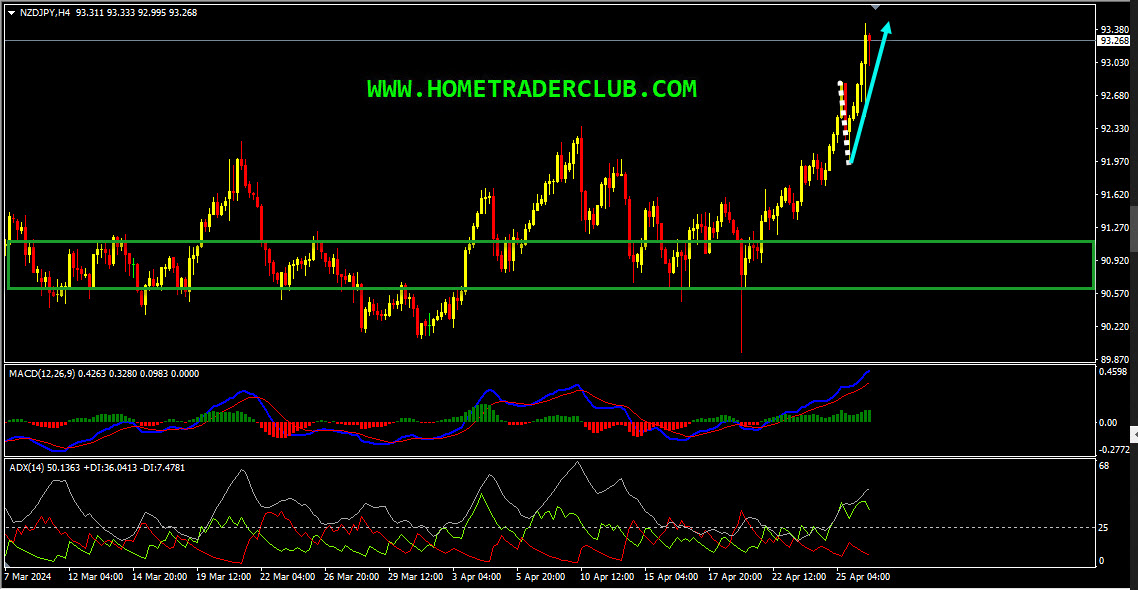
NZDJPY – My idea here was “On the H4 chart, the price which was moving lower reached a strong support zone respected it and bounced higher from this zone. The price then moved higher and has broken above the most recent downtrend line, which we may consider as evidence of bullish pressure. In addition to this, we could see that the price has created a bullish divergence formed between the first low formed at 90.485 and the second low formed at 89.937 based on the MACD indicator. The price then moved higher and broke above the last high at 91.596 creating higher highs, thus forming a classical setup of bullish divergence followed by bullish convergence, we may consider these as other evidences of bullish pressure. In addition to this, the ADX indicator gave a bullish signal here, at the cross of +DI (green line) versus -DI (red line) and the main signal line (silver line) reads a value over 25, we may consider this as yet another evidence of bullish pressure. Also, based on the Heikin Ashi candles we can see that currently, we have strong bullish bodies in upward moving market conditions so it basically reflects a bullish environment. So based on all this, until the strong support zone shown in the image below (marked in green) holds my short-term view remains bullish here and I expect the price to move higher further after pullbacks”.
Current Scenario – In NZDJPY, after the bullish convergence, I was expecting the price to move higher further after pullbacks until the strong support zone holds. The price action followed my analysis exactly as I expected it to here. We had a pullback and then the price moved higher further and has delivered 140+ pips move so far!
For similar trade ideas and much more I invite you to join the Home Trader Club and improve your trading with us.
You will also find a pretty extensive database of educational materials here in the blog – just use the search or check out the Forex Education section above.
If you have any further questions, don’t hesitate to drop a comment below!
Happy Trading!
Arvinth Akash
Home Trader Club Team.
Hi Traders! Arvinth here from the Home Trader Club team. The weekly summary and, review of July…
The Japanese yen surged on Thursday, in a move analysts said bore the hallmarks of…
Hi Traders! EURAUD short term forecast and technical analysis is here. We do our analysis…
Hi Traders! NZDCAD short term forecast update and follow up is here. On June 2nd,…
Hi Traders! NZDCHF short term forecast and technical analysis is here. We do our analysis…
Hi Traders! AUDUSD short term forecast follow-up and update is here. On May 27th 2026…