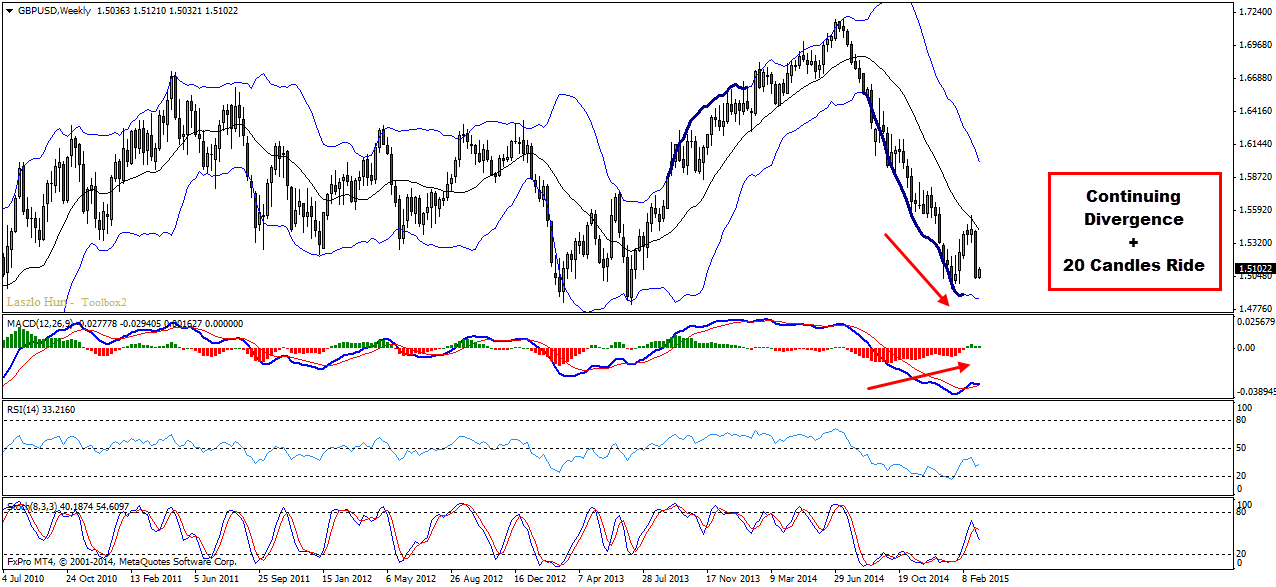
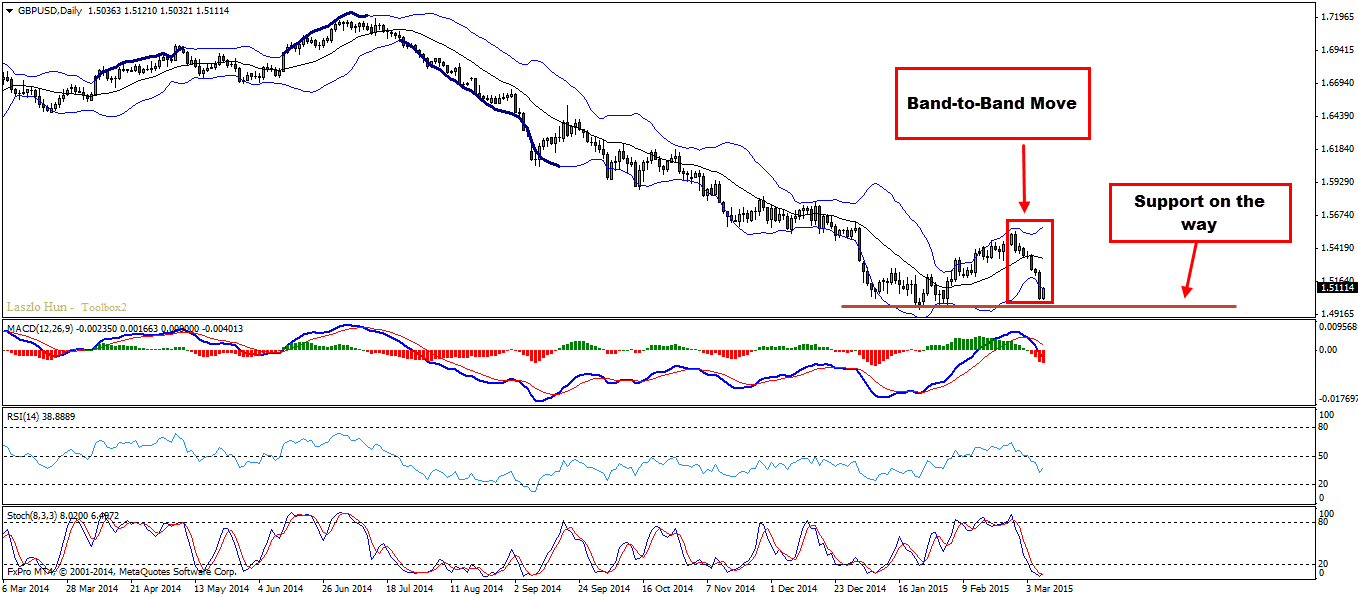
Pair has reached stiff support zone and i believe we will see a bounce and move up at least in the short term. In the longer term, technically we can expect the pair to create one more low on the weekly chart. It is currently under bullish continuing divergence which puts bullish pressure and this is where we want to take advantage.
Technical Overview:
W1 – continuing divergence, 20 candles ride on the Bollinger Bands
D1 – support, band to band move
H4 – extended double wave move, bollinger bands duplication
Entry:
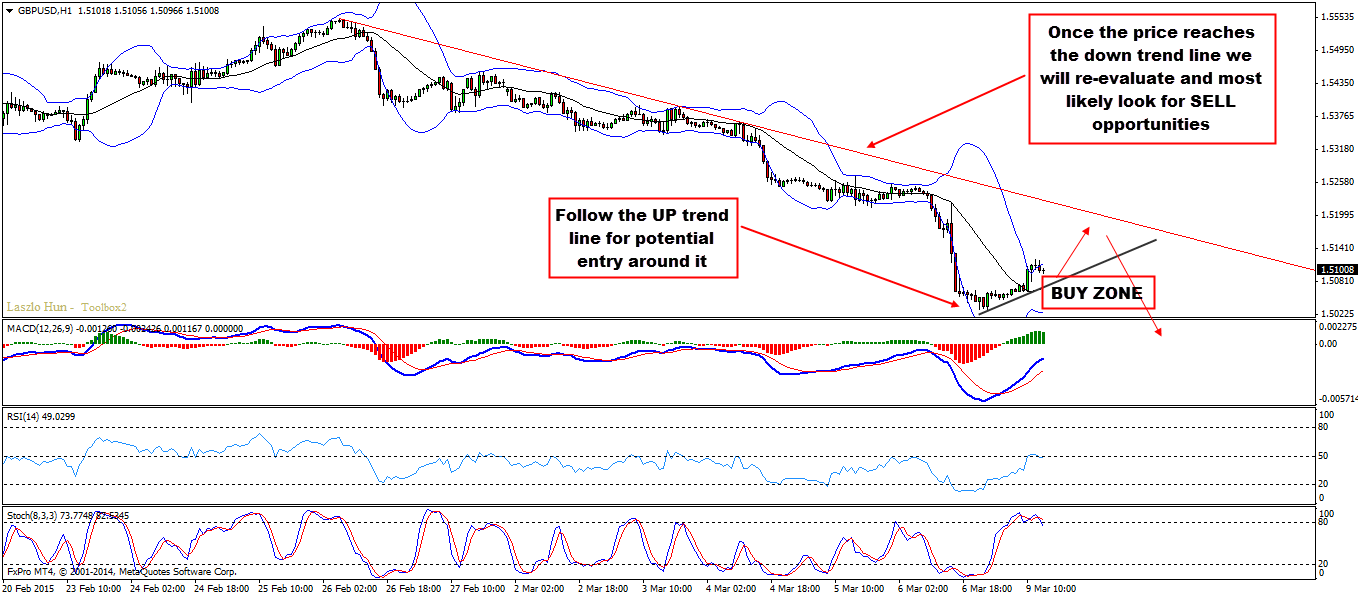
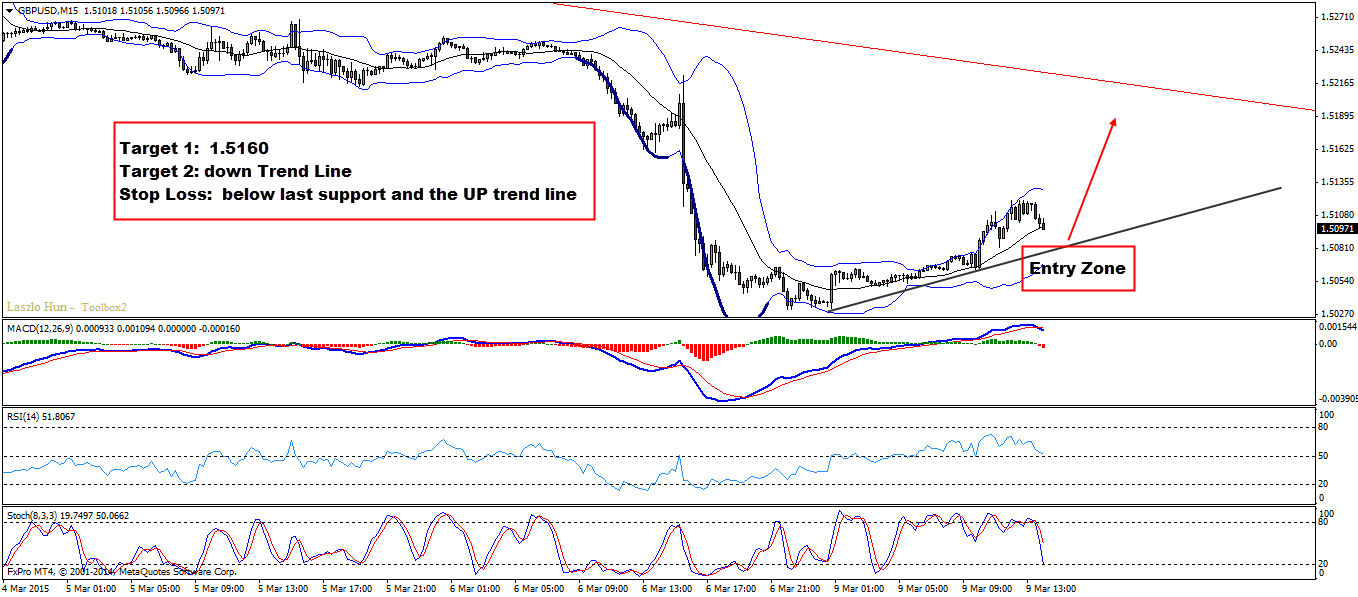
H1/M15 – Drop to the H1 chart or even the m15 chart and look for pull backs to go long. Trigger could be hidden bullish divergence or break of flag/wedge pattern or simply a break of a trend line + resistance.
Target 1: 1.5160
Target 2: down trend line (h1)
Stop Loss: below the up trend line and last support
Video Explanation:
Yours
Vladimir
GDP growth is one of the most important indicators of economic health. But does stronger…
When it comes to fundamental Forex analysis, few institutions matter as much as the Federal…
Interest rates are one of the most important fundamental forces in the Forex market. But…
The latest U.S. employment report has delivered a significant warning for the market. With only…
The Forex market does not always offer clear trading opportunities. Sometimes, price moves sharply in…
Open social media for a few minutes and you can easily find someone talking about…