The new trading week brings several important technical setups across the Forex and commodities markets.
EUR/USD is approaching a major resistance and supply zone around 1.1600–1.1700, while GBP/USD is testing the psychological 1.3500 area and could potentially extend higher before sellers step in.
GBP/JPY is showing an important change in structure after a prolonged bullish trend, raising the possibility of another move below 210.00.
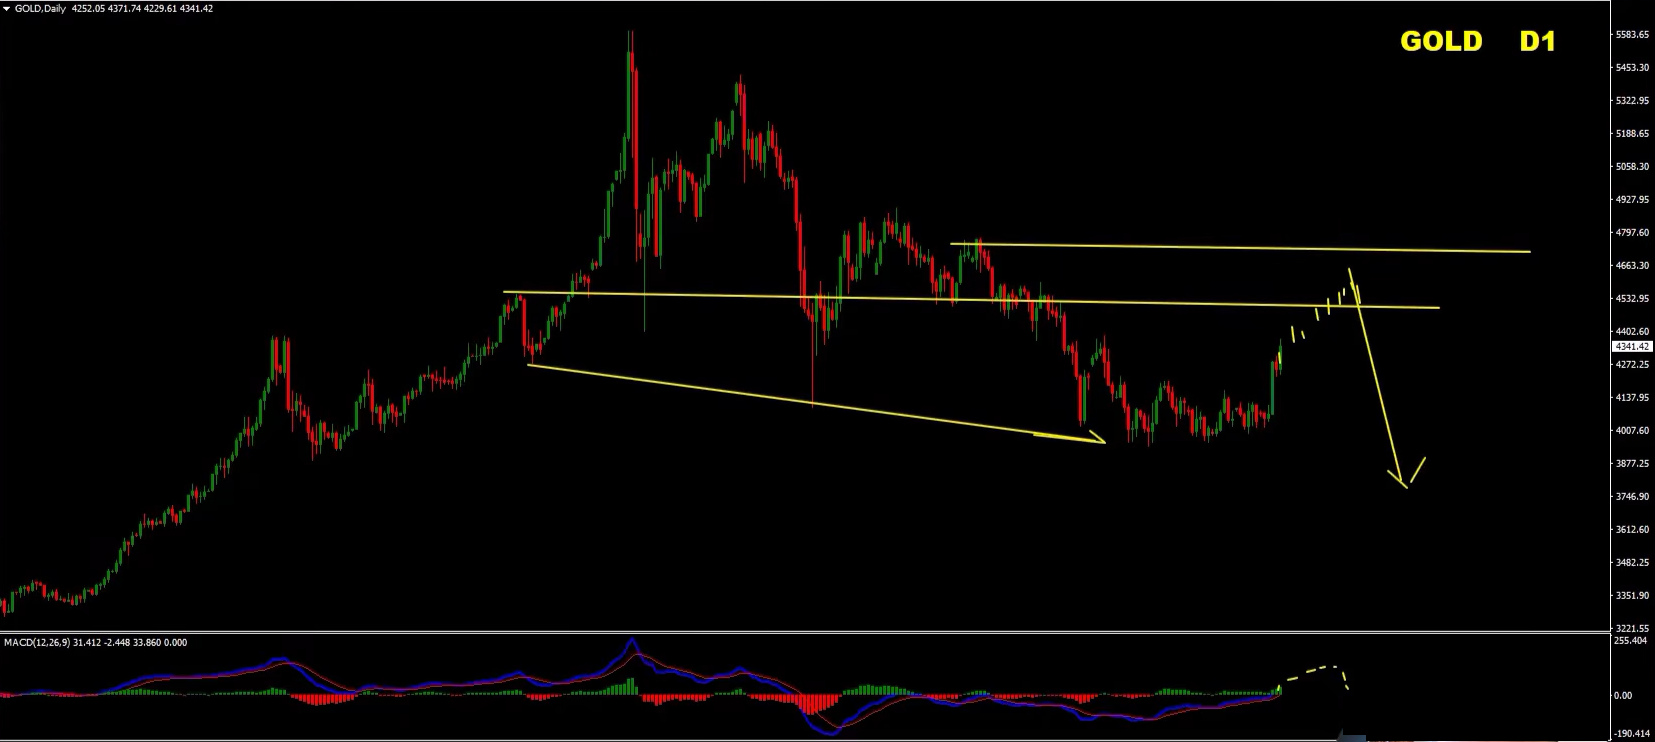
Meanwhile, Gold has regained bullish momentum following the breakout of its recent range, but price is now approaching major supply zones around 4,370 and 4,440–4,500.
In this weekly Forex forecast, we will analyze the technical outlook for:
As always, the focus is not on predicting every single move. Instead, we are looking for high-probability areas where price structure, momentum, divergence, supply and resistance can come together to create potential trading opportunities.
We have partnered with AvaTrade, one of the industry’s leading regulated brokers.
When you open and trade with AvaTrade through our partnership, you receive:
If you’re looking to accelerate your trading journey while enjoying premium education, this partnership gives you everything you need under one roof.
If you already have account with them, still follow this link to open separate account with separate email. Once you did that, contact me with the telegram link below and we will give you the access.
Let’s go straight into the charts.
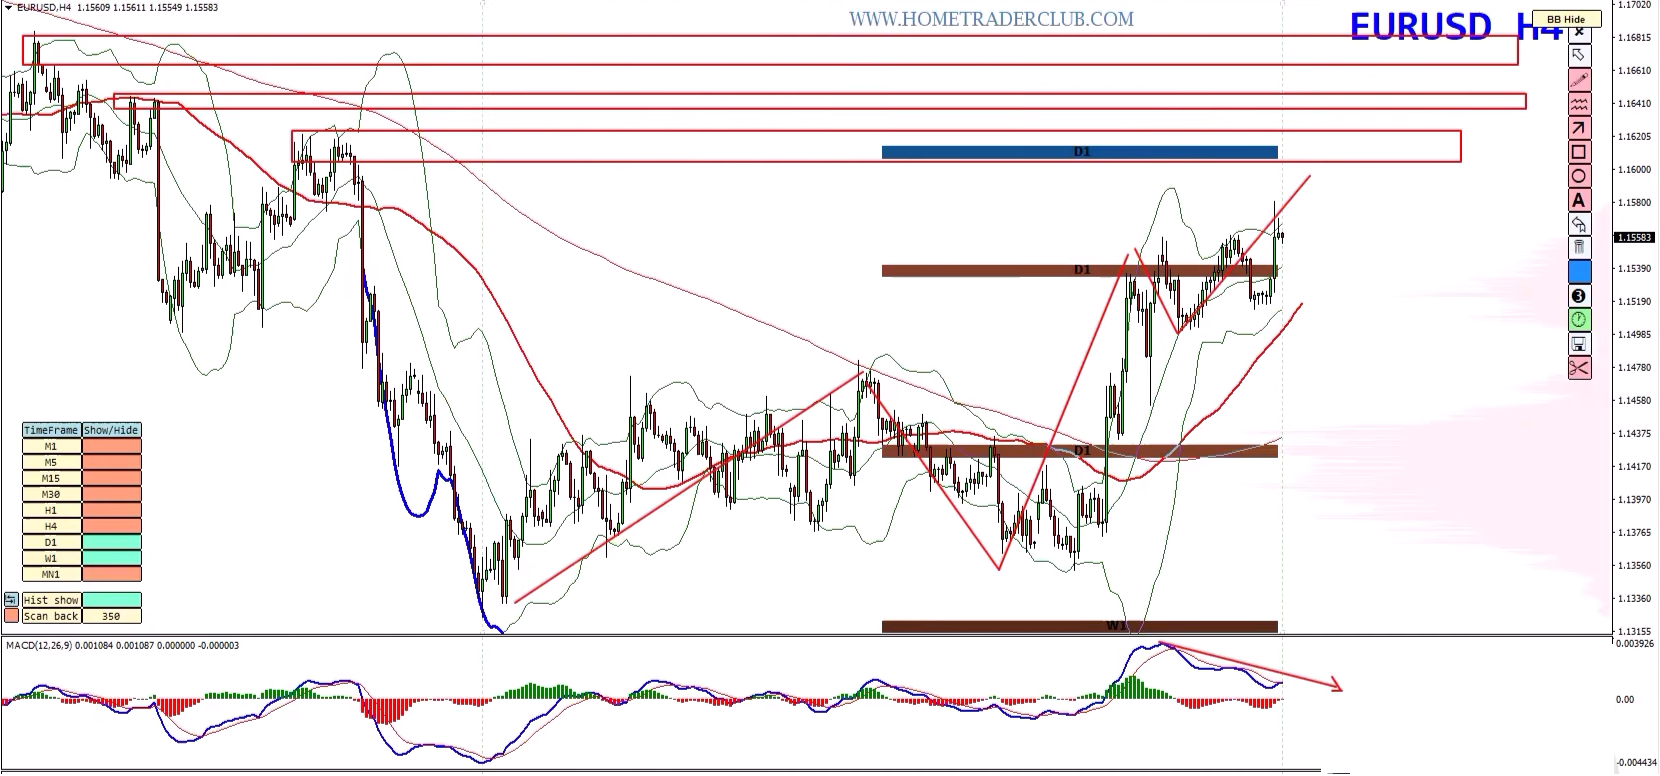
EUR/USD remains one of the most interesting pairs to watch this week.
While the longer-term direction remains controversial, the shorter-term chart is approaching a very important technical area where sellers could potentially become active.
The main zone I am watching is approximately:
1.1600–1.1680/1.1700
This area represents a significant supply and resistance zone.
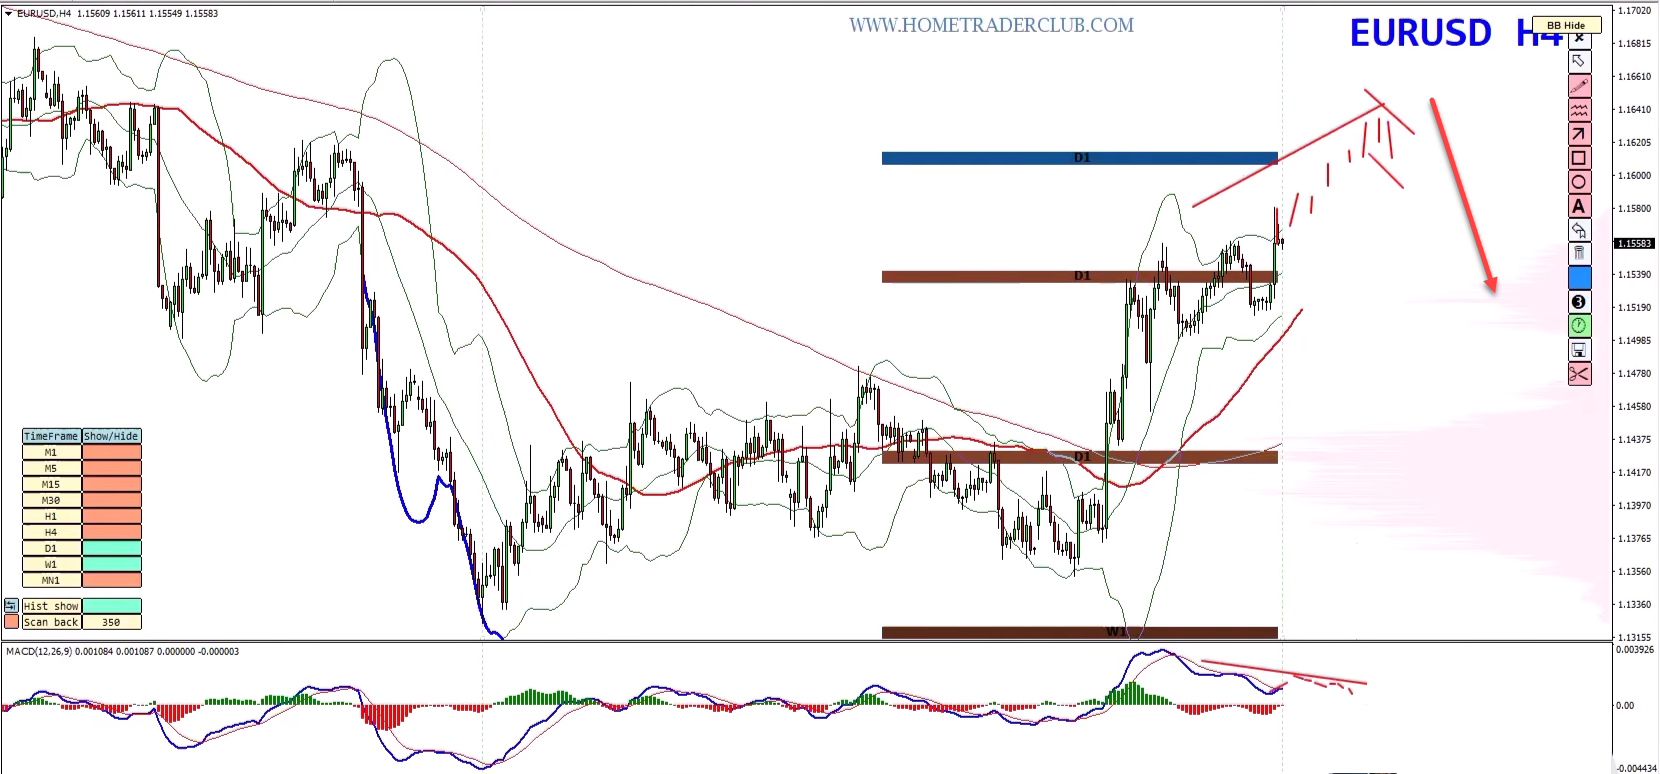
On the H4 chart, price is attempting to complete a multi-wave structure.
At the same time, we can see an important momentum warning developing.
Price has been making higher highs, while the MACD is beginning to form lower highs.
This creates a potential bearish divergence.
Bearish divergence does not automatically mean that price must reverse immediately. However, when it develops near a strong resistance or supply area, it can become a very important warning that buyers are beginning to lose momentum.
This is exactly what makes the current EUR/USD structure interesting.
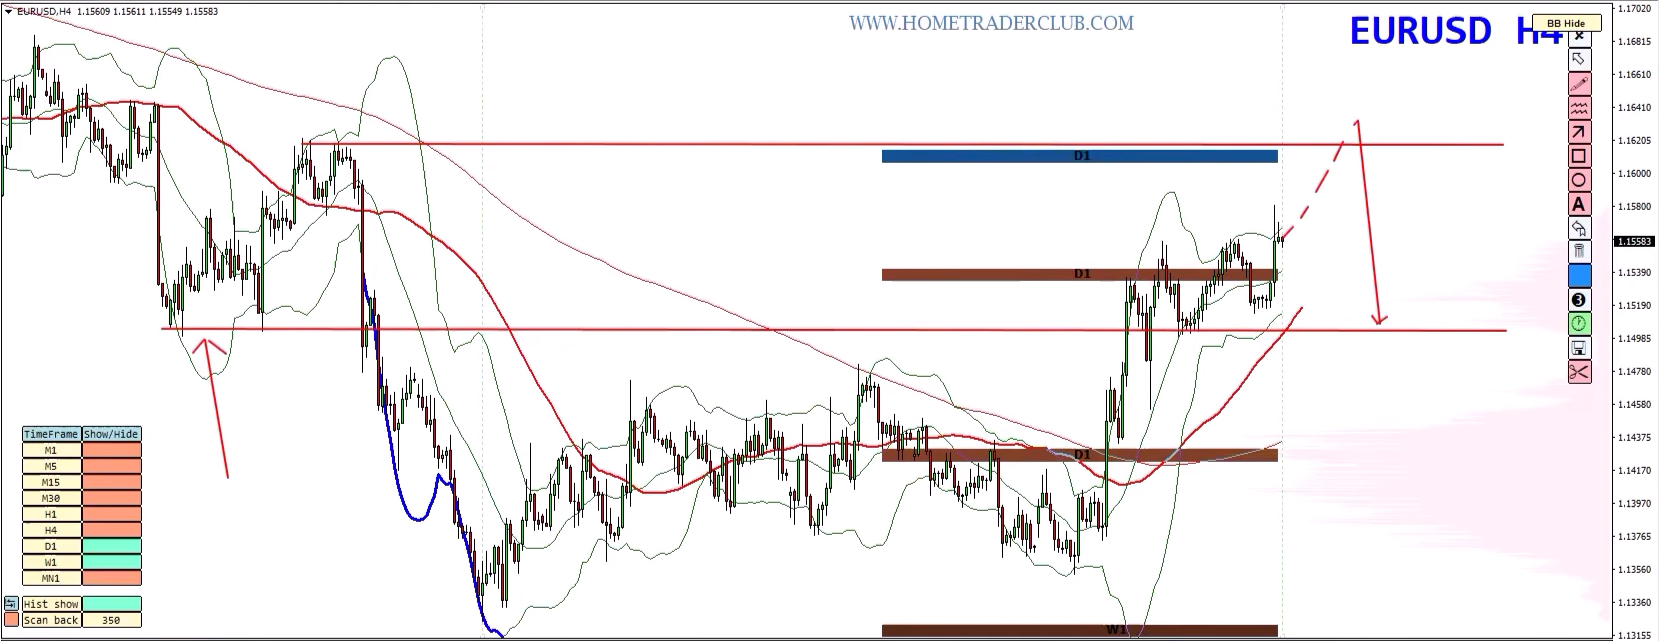
The ideal scenario would be for price to continue moving into the resistance zone, complete the current wave structure, and then begin showing confirmation of bearish momentum.
The confirmation would ideally include:
If these conditions develop, the probability of another downside move increases significantly.
If EUR/USD reacts from this resistance zone and begins forming a clear bearish structure, I will be looking for selling opportunities on rallies.
The first major downside area to watch is around:
1.1500
If the previous high is retested or broken and price subsequently fails to hold the resistance zone, the downside move could potentially extend even further.
Short-term bias: Bearish from the 1.1600–1.1700 supply zone, provided bearish confirmation develops.
The key message is simple:
I would rather sell the rallies than chase EUR/USD higher while price is approaching this major resistance area.
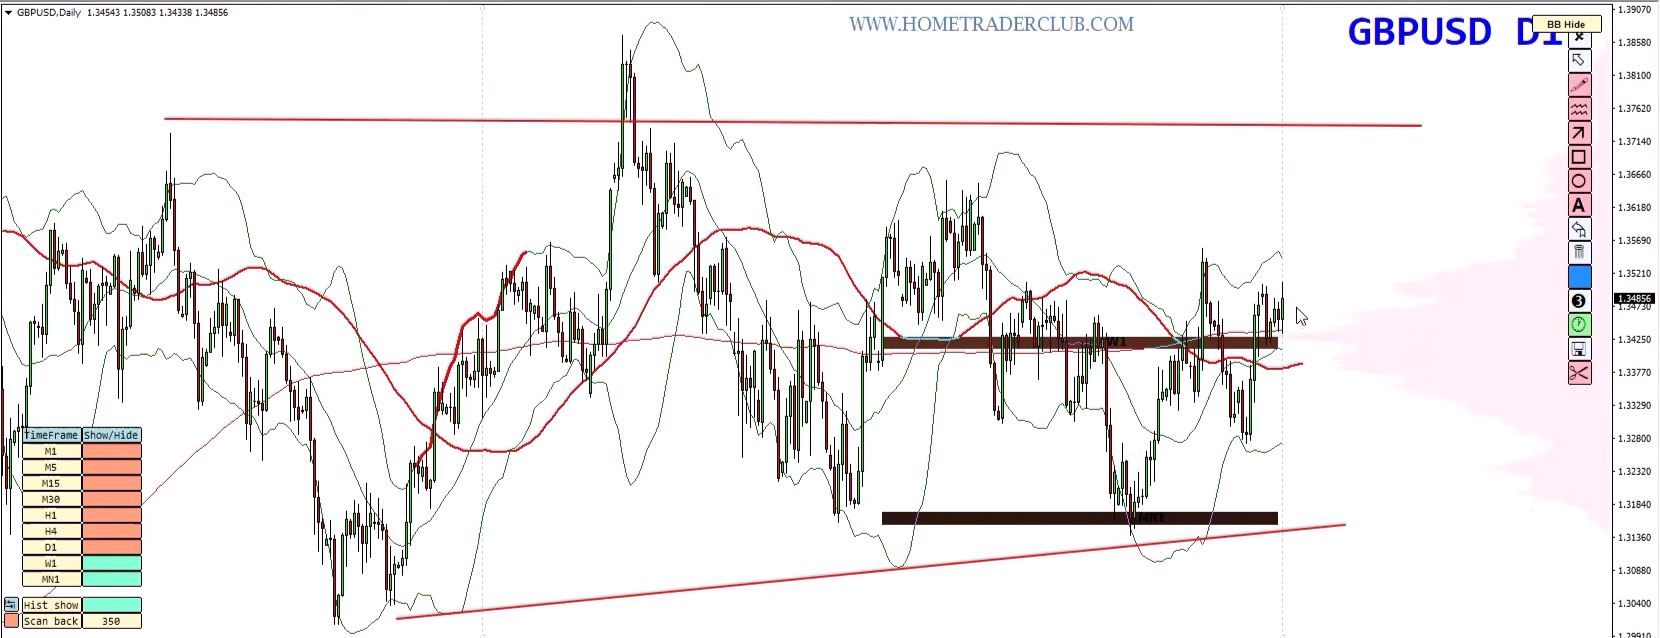
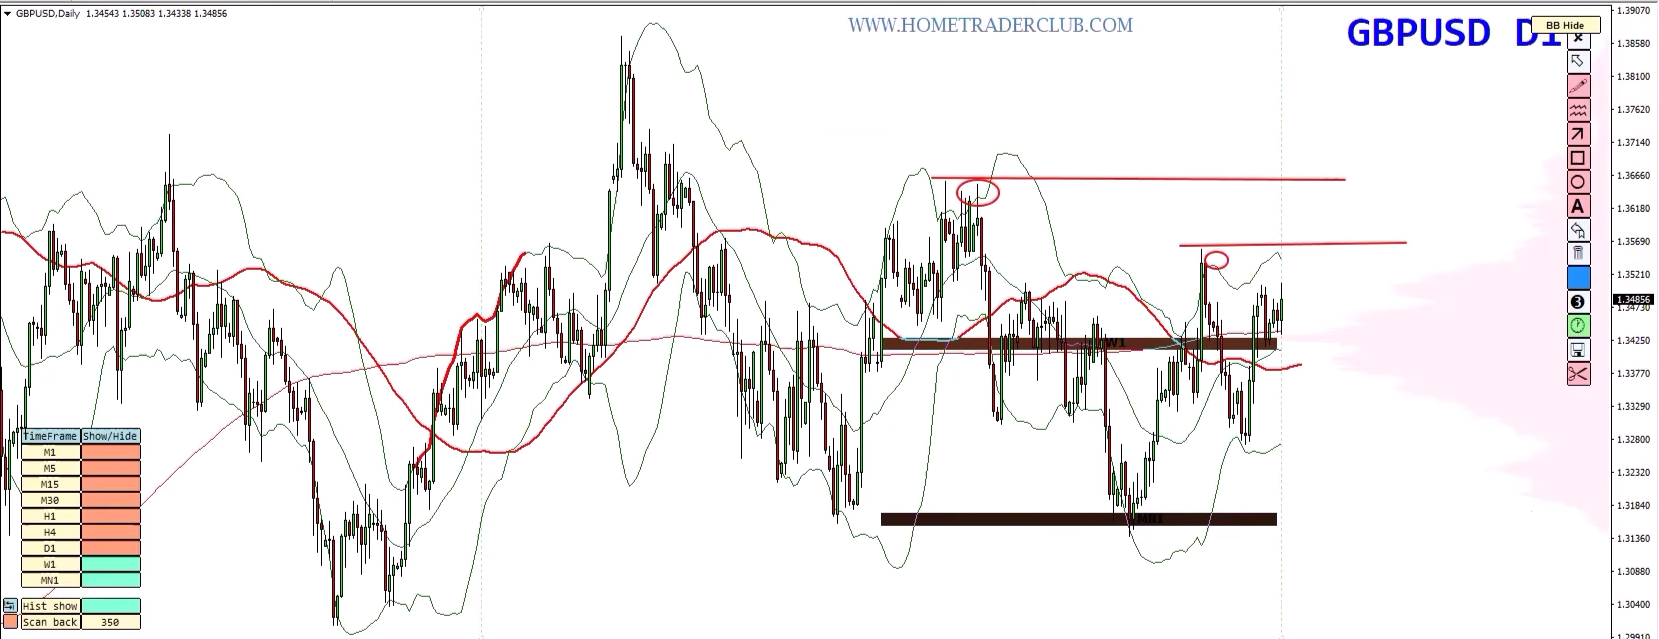
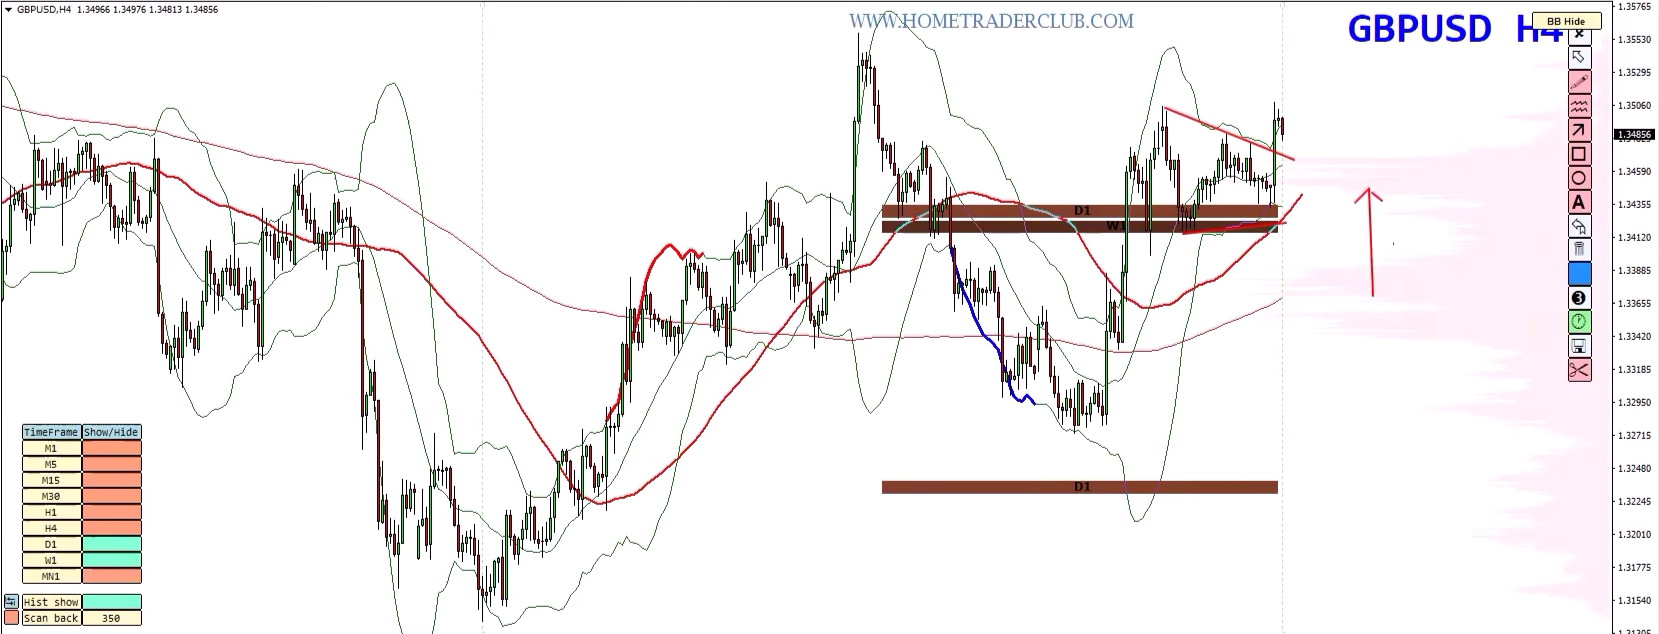
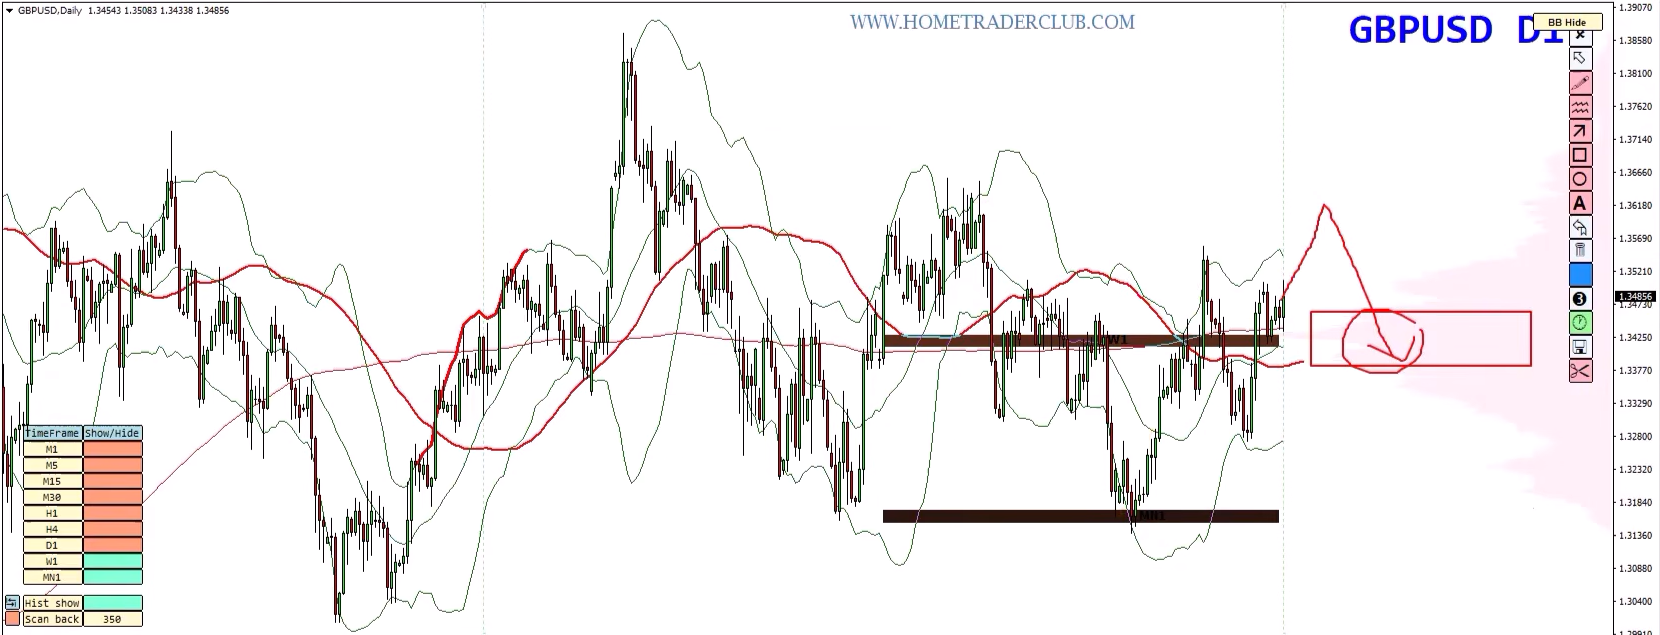
GBP/USD is another pair approaching a very important technical area.
The long-term outlook remains bullish, and I have no major doubts that the Pound can continue to target higher levels over the longer term.
However, the short-term structure is much more interesting.
GBP/USD is still moving inside a relatively broad range, while several important supply zones are positioned above current price.
The first major psychological level is:
1.3500
Above that, we have additional areas around:
1.3550
1.3600
1.3650
These levels could become important if the current bullish momentum continues.
The pair recently attempted to break out of its range and is currently trading above the balanced area identified through the volume profile.
As long as price continues to hold above this area, there is a good probability that GBP/USD could push higher and complete another leg to the upside.
This means we should not immediately assume that the Pound must fall.
In fact, the beginning of the week could bring another bullish move.
The key question is what happens after price reaches the higher resistance levels.
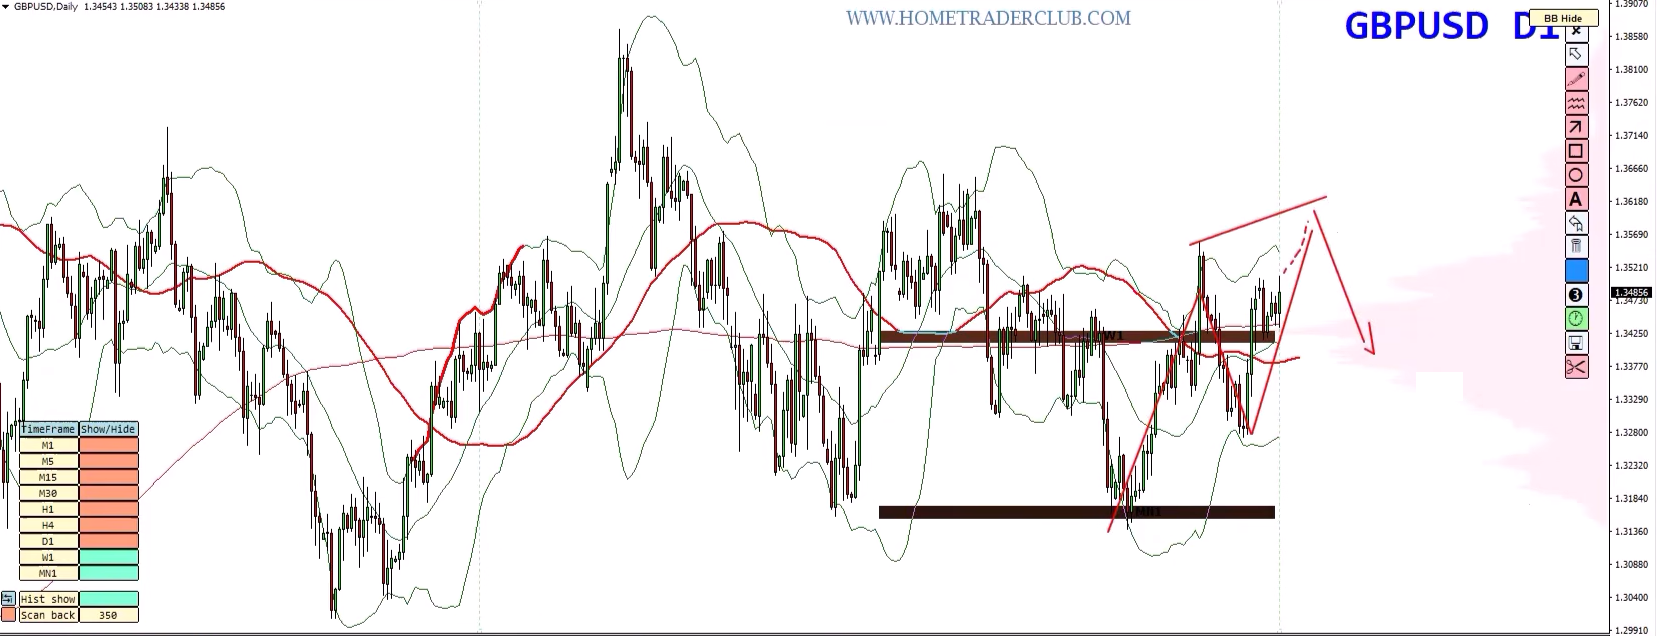
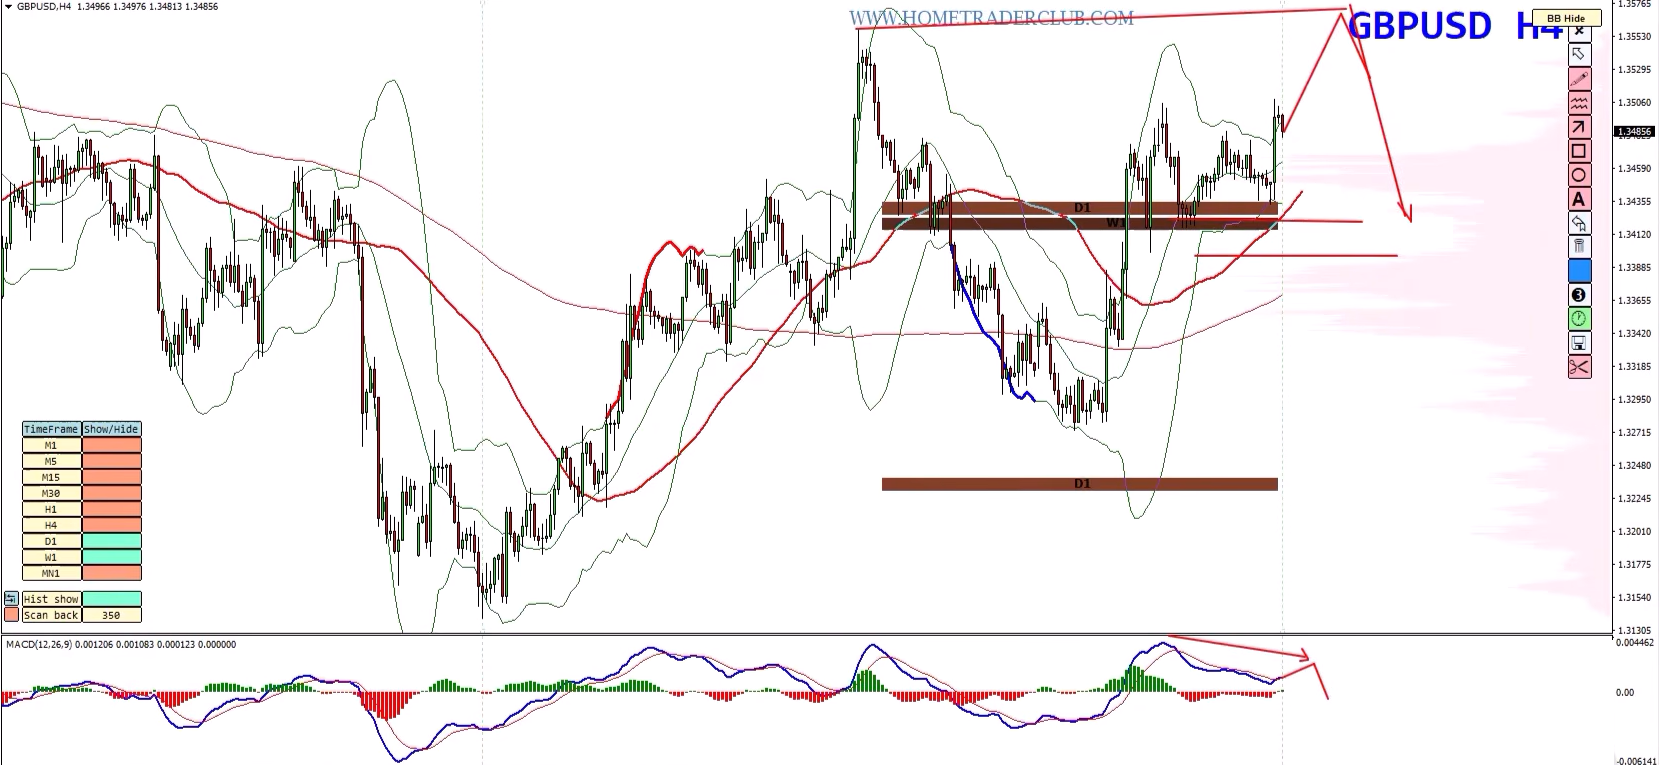
The bigger opportunity could develop if GBP/USD reaches the 1.3500–1.3650 region and begins creating bearish divergence on the higher timeframes.
I am particularly interested in the possibility of:
If these conditions align, sellers could enter the market aggressively.
If GBP/USD completes the final bullish leg into the resistance zone and begins showing bearish confirmation
The pair could potentially fall back toward the volume profile balanced area.
One of the important downside areas to watch is around:
1.3400
This area could act as a magnet if the breakout loses momentum and price returns inside the previous balanced structure.
The recent U.S. Non-Farm Payrolls report disappointed expectations and suggested some weakening in the U.S. labor market.
This has influenced expectations surrounding Federal Reserve policy and contributed to recent anti-Dollar moves.
That fundamental backdrop could help GBP/USD push higher at the beginning of the week.
However, fundamentals may provide the initial direction while technical levels determine where the next major reaction develops.
Short-term bias: Bullish while above the balanced area, but watch 1.3500–1.3650 closely for potential bearish reversal confirmation.
The strategy I am watching is therefore:
Allow the rally to develop first, then look for evidence that sellers are returning.
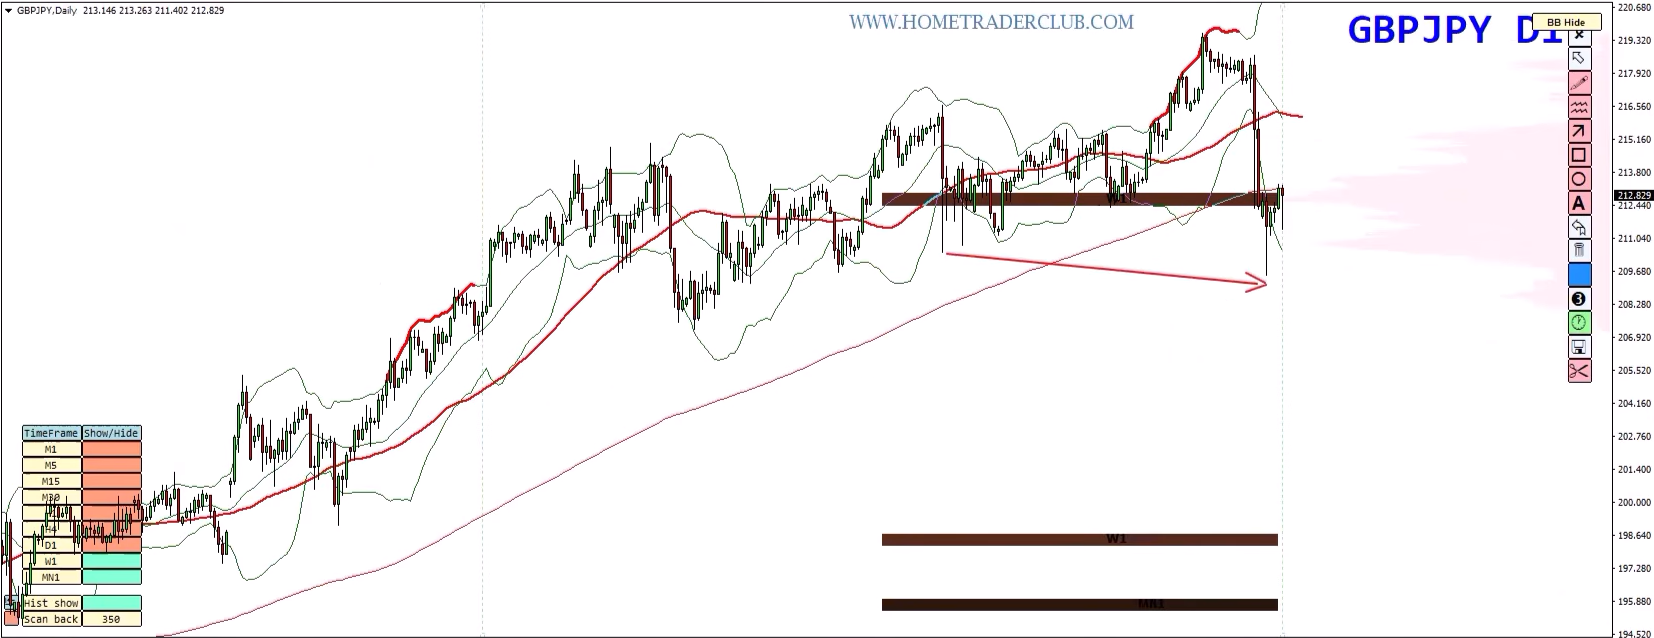
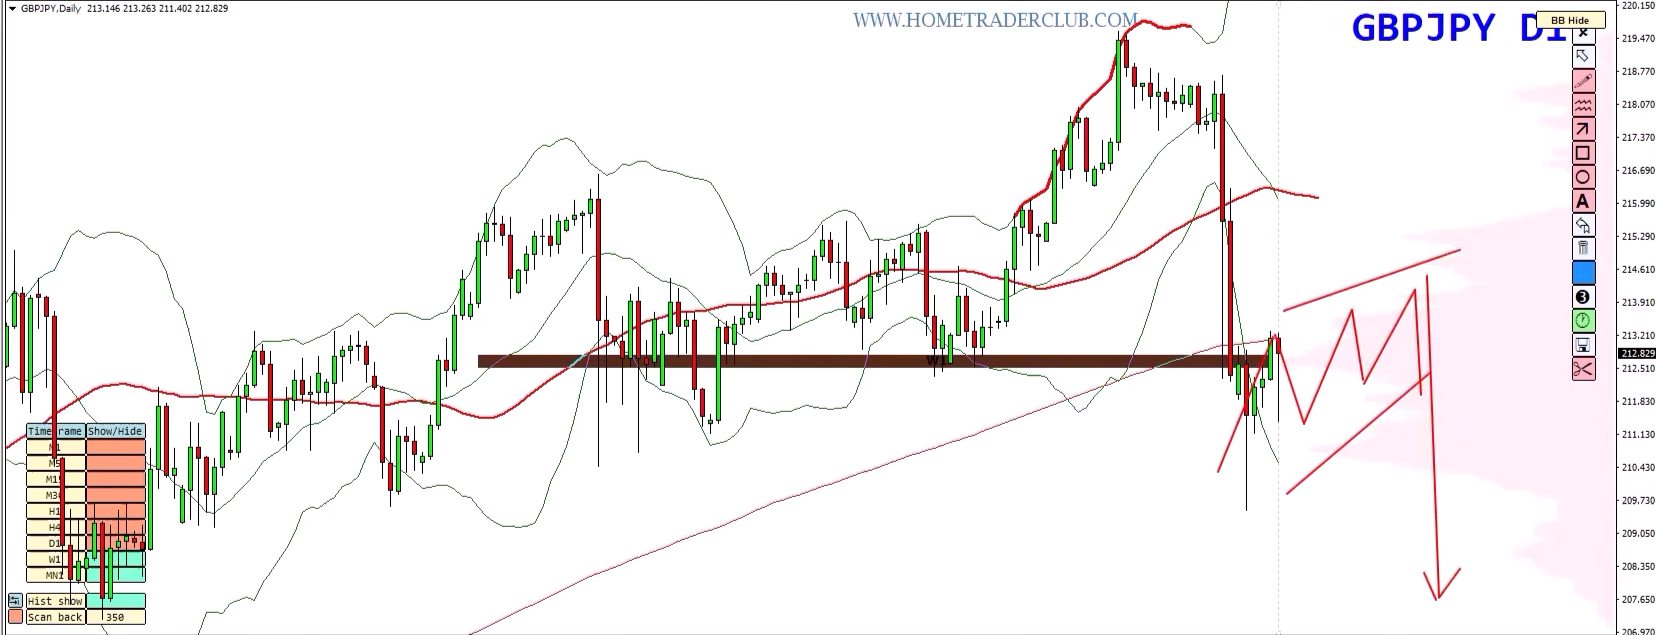
GBP/JPY is showing one of the most interesting structural changes among the markets discussed this week.
After a very long bullish trend, the pair has now printed lower lows for the first time, which is something we should not ignore.
This potentially signals that the market structure is changing.
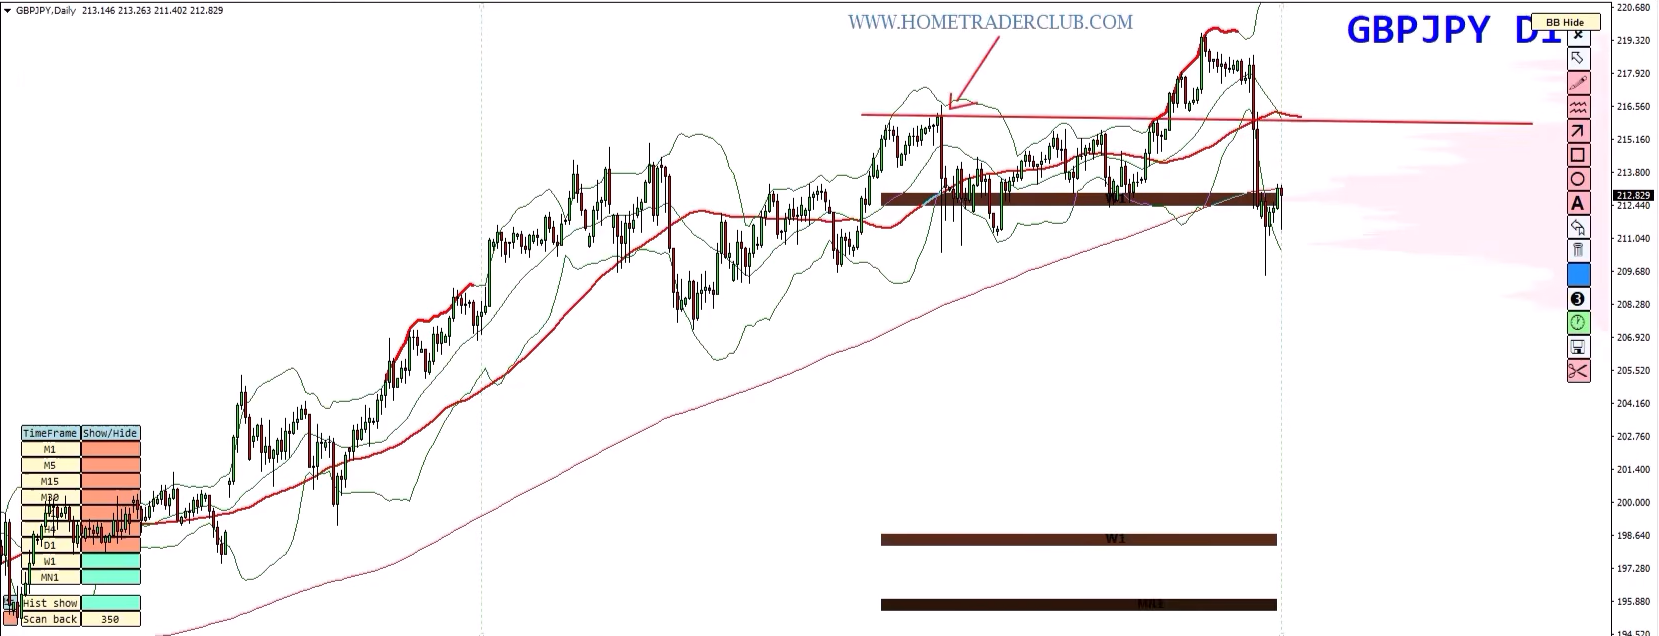
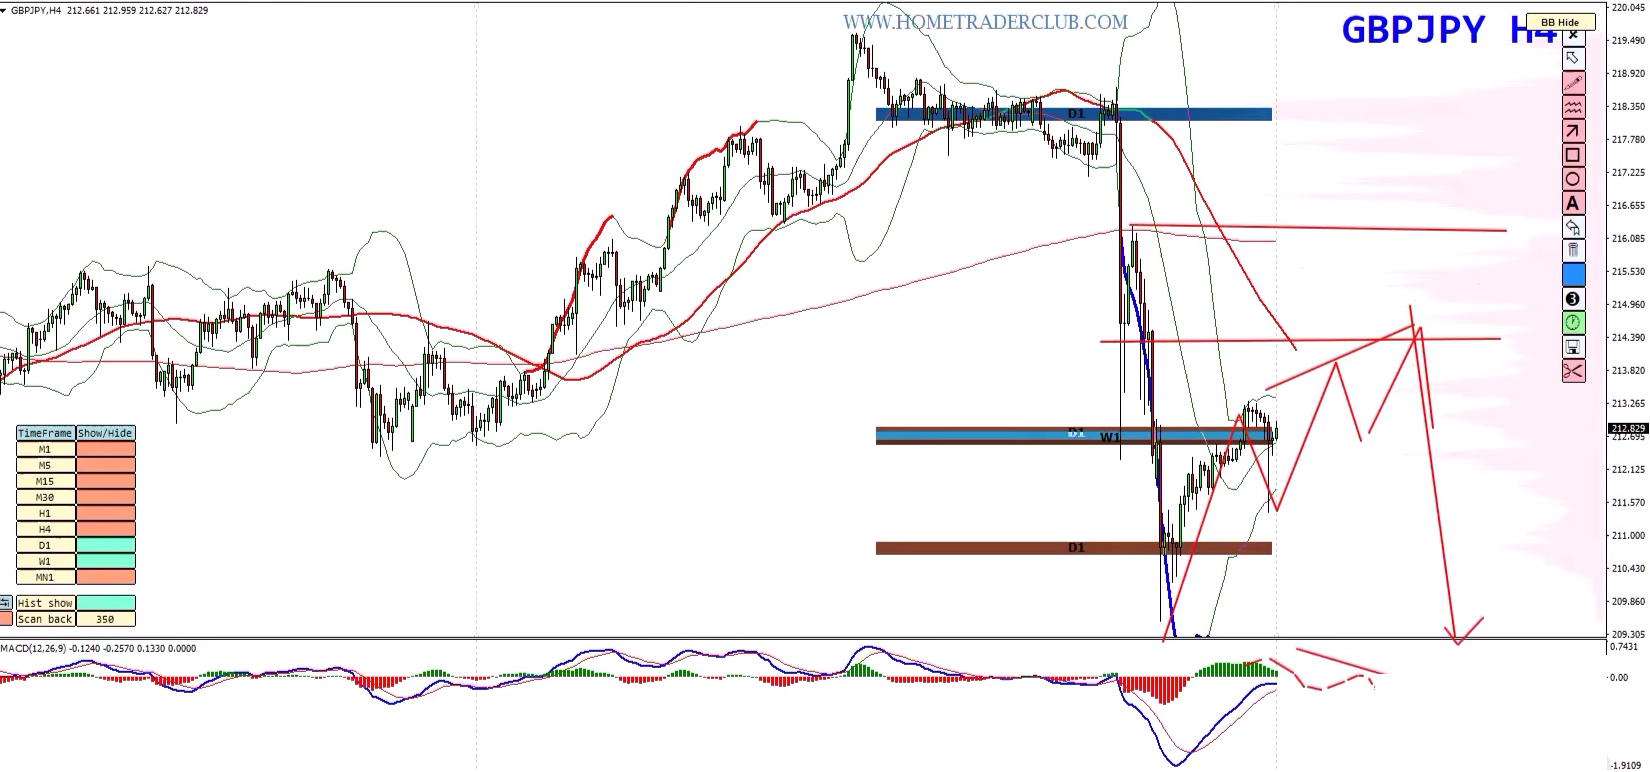
The question now is whether GBP/JPY can retest its previous highs, create another corrective structure, and then continue lower.
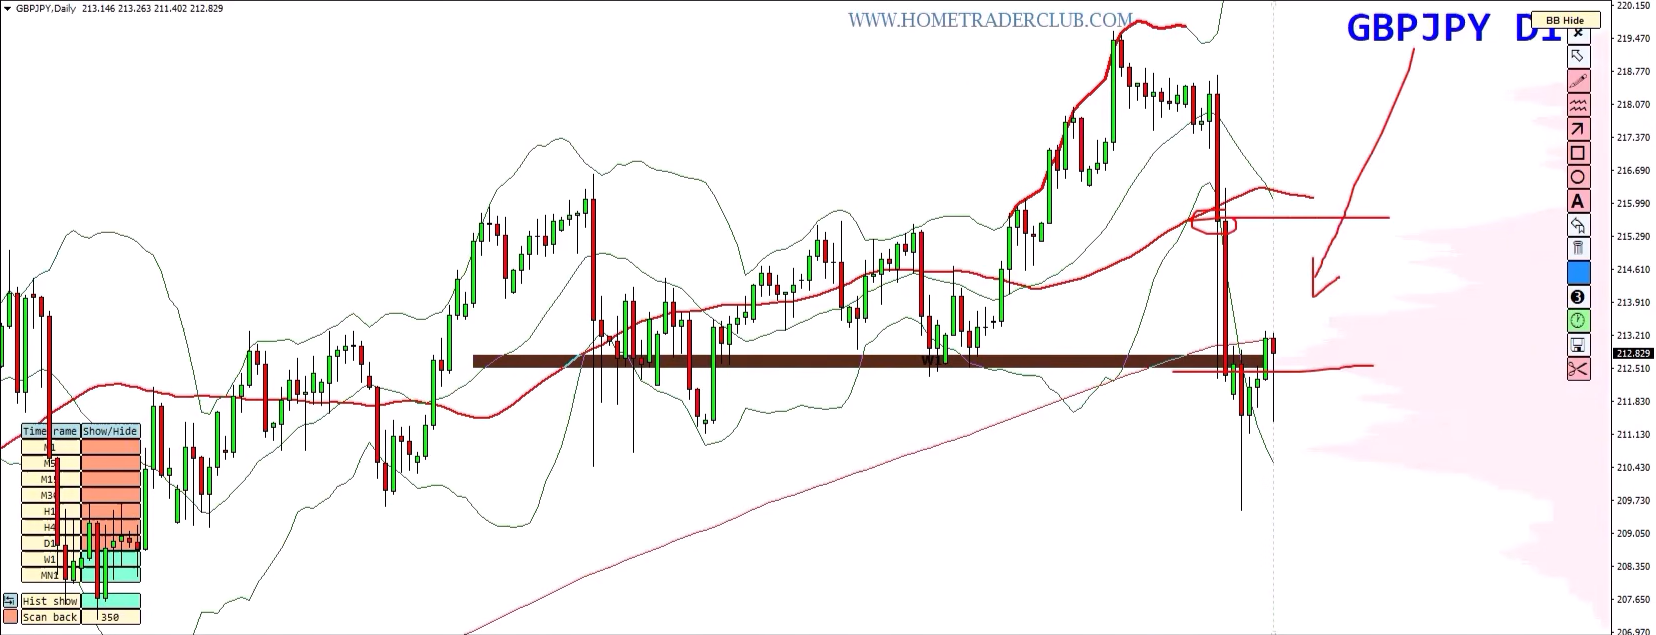
The major area I am watching is the previous high and the broader supply zone surrounding it.
This zone became extremely important because of the price action that developed previously.
During the large bearish candle, we saw a massive sell-off.
Sellers clearly took control.
Buyers then attempted to recover the market, pushing price back toward the zone.
But sellers returned again and regained control.
This tells us something important:
There is significant seller interest inside this entire area.
Therefore, I consider this region a major supply zone.
GBP/JPY could potentially move back and forth around this area and complete another corrective or ABCD-type structure.
If that happens, I will be looking for bearish confirmation on the lower timeframes.
The ideal setup would include:
Once these signals align, the next selling opportunity could develop.
The technical structure gives us a strong reason to consider another move lower.
The longer-term bullish trend has already experienced a structural warning through the creation of lower lows.
If the supply zone continues to hold, GBP/JPY could potentially target:
210.00 and below
This is an important psychological level and one that traders should continue monitoring closely.
Short-term bias: Sell the rallies from major supply, provided bearish confirmation appears.
I believe GBP/JPY has both technical and fundamental reasons to potentially move below 210 again.
But, as always, I want the market to confirm the setup rather than simply selling because the level looks attractive.
Now let’s move to Gold.
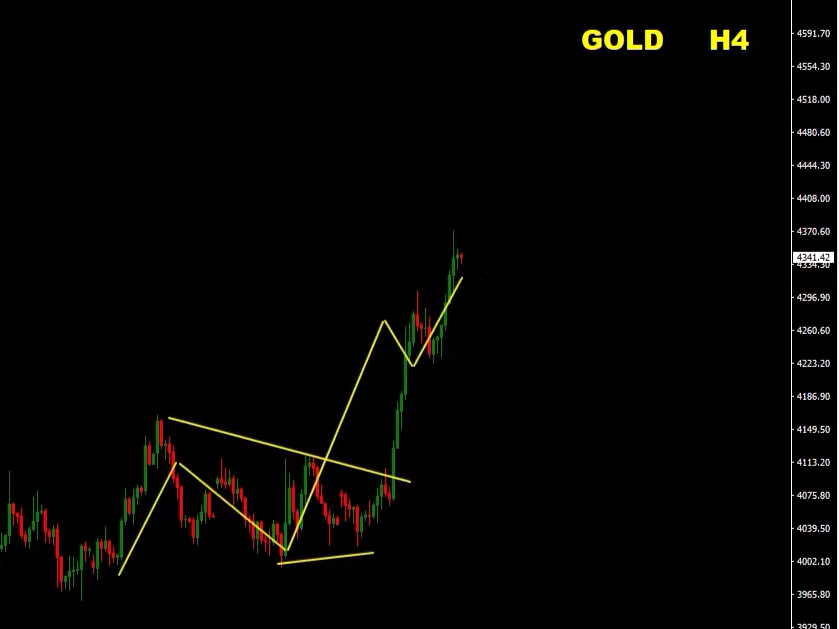
Gold has finally broken out of the range we have been monitoring and has regained bullish momentum.
At the moment, there are no major contradictory technical signals suggesting that the bullish move is already finished.
However, the market is approaching several very strong supply zones.
That means we need to be careful about chasing the rally.
The breakout from the range has restored bullish momentum.
The current price structure suggests that Gold could continue moving higher in the short term.
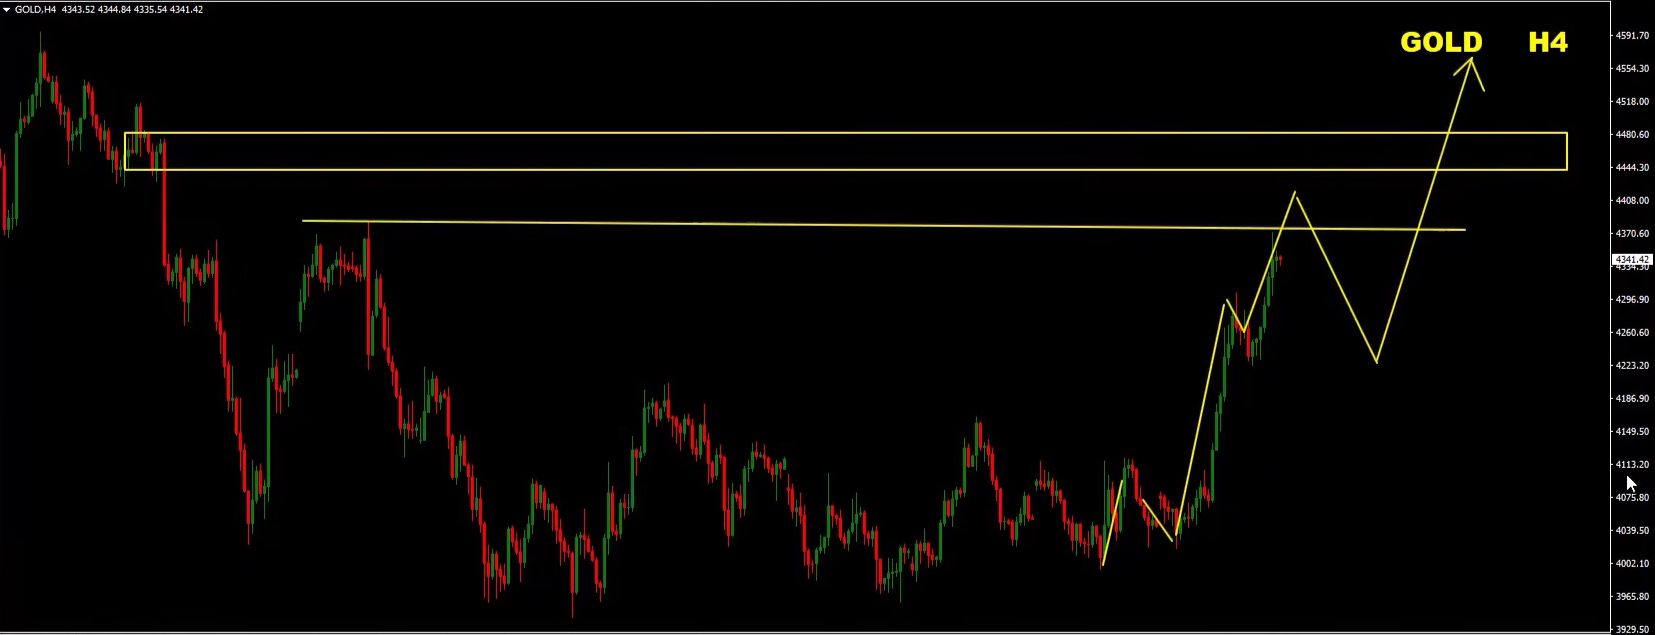
Based on the daily chart structure, there are several previous highs that could become important targets.
The first major supply area I am watching is around:
4,370
Above that, another extremely important zone is:
4,440–4,500
These are major levels of interest.
As long as Gold continues to respect the current bullish structure, further upside remains possible.
The market could continue creating bullish waves toward the previous daily highs.
The key areas to monitor are:
If price reaches these areas, we should start looking carefully for signs of bearish pressure.
Although the current momentum remains bullish, the major supply zones could eventually create another bearish reaction.
The ideal bearish setup would be:
If this happens, the market could experience a significant corrective move.
But right now, I do not see enough evidence to aggressively sell Gold before bearish confirmation appears.
Short-term bias: Bullish toward major supply, with 4,370 and 4,440–4,500 as critical zones to monitor for potential bearish pressure.
For now, the bullish waves deserve respect.
The important thing is to avoid assuming that a reversal has started before the chart actually confirms it.
Here is a quick summary of the most important levels discussed in this week’s forecast.
| Market | Key Resistance / Supply | Potential Area of Interest |
|---|---|---|
| EUR/USD | 1.1600–1.1700 | Potential sell-the-rally zone |
| GBP/USD | 1.3500–1.3650 | Potential reversal zone |
| GBP/JPY | Major previous-high supply | Potential sell-the-rally zone |
| Gold | 4,370 | Major supply |
| Gold | 4,440–4,500 | Major supply / reversal area |
These levels should not be treated as automatic buy or sell signals.
Instead, they are areas where traders should start paying closer attention to price action, momentum and confirmation.
The overall theme for this week is very interesting.
Several markets could initially continue moving in the direction of the current momentum before reaching major higher-timeframe resistance or supply.
That means patience will be extremely important.
Sell the rallies if bearish divergence and lower-timeframe confirmation develop around 1.1600–1.1700.
Potential downside focus:
1.1500 and potentially lower.
Allow the short-term bullish move to develop while price remains above the balanced area.
Watch:
1.3500 → 1.3550 → 1.3600 → 1.3650
If bearish divergence and structure develop, look for selling opportunities toward the 1.3400 region.
Watch the major supply zone around the previous high.
If price completes its corrective structure and bearish divergence develops, look for opportunities to sell the rallies.
Potential downside focus:
210.00 and below.
The bullish momentum remains intact following the range breakout.
Watch:
4,370 → 4,440–4,500
At these levels, look for signs of bearish pressure before considering a reversal setup.
Every forecast should have more than one scenario.
Why?
Because great trading is not about being right every time.
It is about being prepared for what the market actually does.
If price reaches your resistance zone but there is no bearish confirmation, don’t force the sell.
If price reaches support but buyers do not appear, don’t force the buy.
Let the market confirm your idea.
Use the higher timeframe to identify the important zones, use the lower timeframe to find the entry confirmation, and always manage your risk.
The level gives you the location.
The structure gives you the direction.
The confirmation gives you the entry.
That is the approach I will continue to follow this week.
Want to access the tools, systems, and real-time education we use daily?
With AvaTrade Broker’s support, you can now enjoy up to one full year of access to the Home Trader Club — including:
All professional trading systems
Access to our new project, the Home Trader Club trade copier, where our traders trade and you can copy.
Real-time trade ideas and setups
Full access to our course library and trading marketplace
Wishing you a profitable week ahead!
Vladimir Ribakov
Internationally Certified Financial Technician
Home Trader Club
When it comes to fundamental Forex analysis, few institutions matter as much as the Federal…
Interest rates are one of the most important fundamental forces in the Forex market. But…
The latest U.S. employment report has delivered a significant warning for the market. With only…
The Forex market does not always offer clear trading opportunities. Sometimes, price moves sharply in…
Open social media for a few minutes and you can easily find someone talking about…
EURUSD, GBPUSD, USDJPY, Gold and Bitcoin remain at important technical levels as volatility and geopolitical…