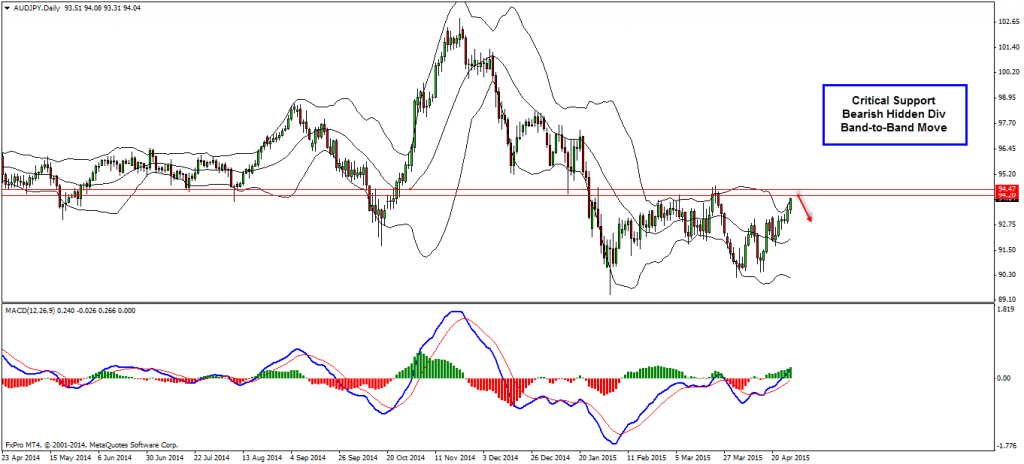
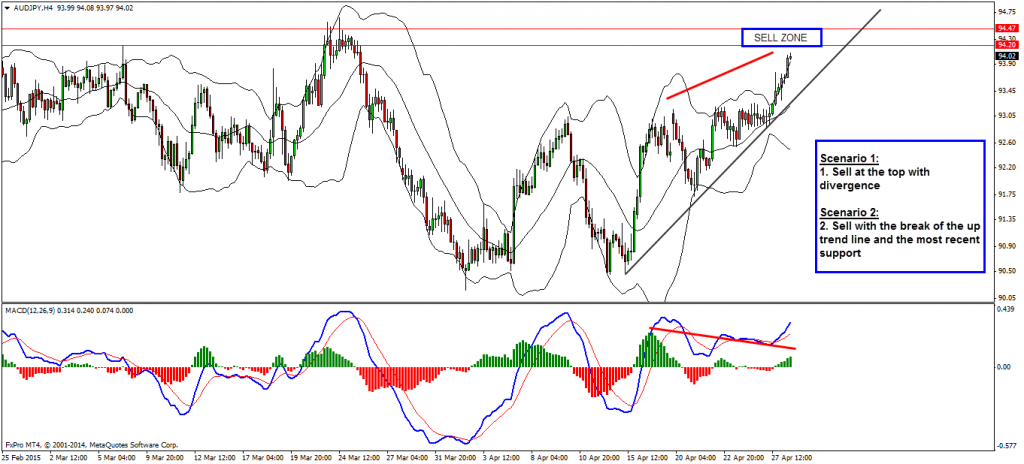
I’m bearish for the AUDJPY for a few reasons. First of all the pair is reaching a critical resistance zone on the daily chart. Next there is bearish hidden divergence forming again on the daily chart along with band-to-band move on the bollingers. Is it classical band-to-band? For sure not but it is still one so we consider it as well. Dropping to the H4 chart we see that there is already bearish divergence. The plan is to wait for the price to push a bit higher near the 94.20-50 range and look for sell entry.
Technical Analysis:
D1 – major resistance zone, band-to-band move on the bollingers, hidden bearish divergence
H4 – bearish divergence, up trend line
Entry:
H4
Scenario 1:
We can try to sell on the H4 chart once the bearish divergence completes. This means we want to see a bearish candle pattern within the 94.20-50 zone.
Target 1: H4 20 MA
Target 2: 92.40
Stop Loss: above last high created
Scenario 2:
Alternatively and more conservative approach would be to wait for the up trend line to be broken along with the most recent support level.
As a target we can use 20 MA of the daily chart.
Video Explanation
EURUSD, GBPUSD, USDJPY, Gold and Bitcoin remain at important technical levels as volatility and geopolitical…
A winning trade feels good. A series of winning trades feels even better. Confidence increases.…
The Forex and commodities markets are entering an interesting phase, with renewed inflation concerns, expectations…
Central banks do more than change interest rates. They also influence financial markets through the…
When traders first learn fundamental analysis, one of the easiest assumptions to make is: Good…
When you open a Forex trade, you may be focused on one thing: Will price…