Hi Traders! AUDUSD forecast update and follow up is here. On April 8th I shared this “AUDUSD Forecast” in Trading View. This trade moved perfectly as per my plan and has provided us fantastic profits. If you would like to learn more about the way we trade and the technical analysis we use then check out the Traders Academy Club. Spoiler alert – free memberships are available! In this post lets do a recap of this setup and see how it has developed now.
Missed this trade?
Never miss a trade opportunity again! Join the Traders Academy Club
Now lets summarize the idea first:
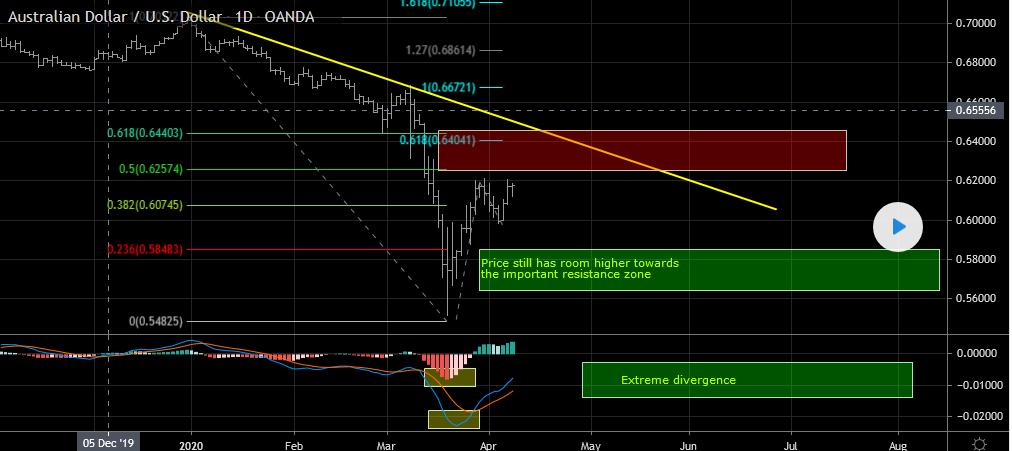
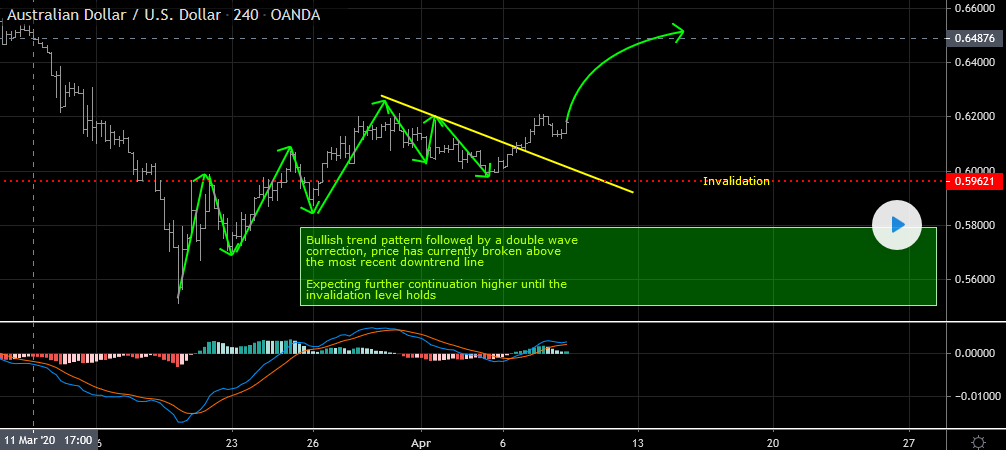
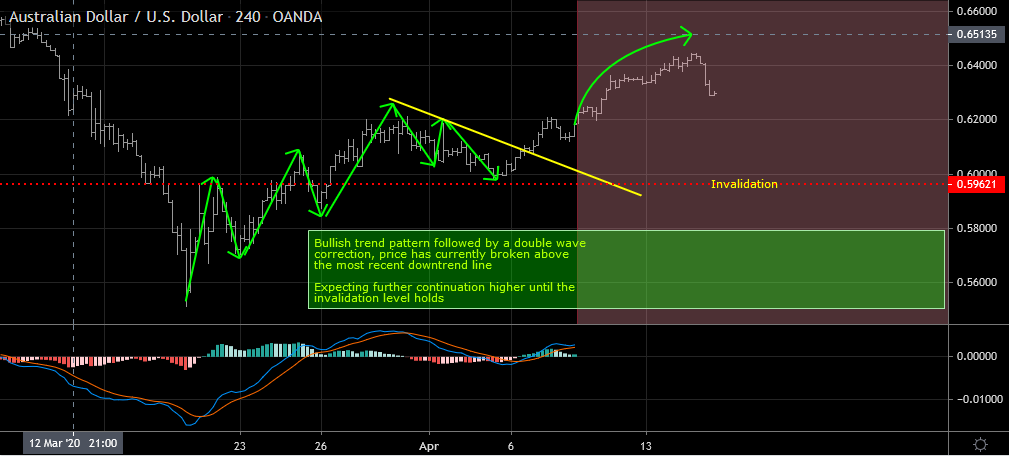
On the H4 chart the price moved perfectly as per my plan. After the breakout of the most recent downtrend line, the price continued higher towards the strong resistance zone exactly as I expected, this buy trade has provided us fantastic profits! After reaching the important resistance zone we got opposite evidences on multiple timeframes so we cashed out of this buy trade.
As I always say, we traders should always trade the facts, we found bullish evidences on multiple timeframes and we had a strong resistance zone so we were expecting the price to move higher towards this zone but we should always be careful and should watch for opposite evidences once we get them especially on multiple timeframes then that’s the time to cash out of our trade. Here we got opposite evidences on both D1 and H4 timeframes after the price reached the resistance zone so we cashed out of the trade. Now its time to reanalyze the charts, have a different read and see what this pair has in store for us.
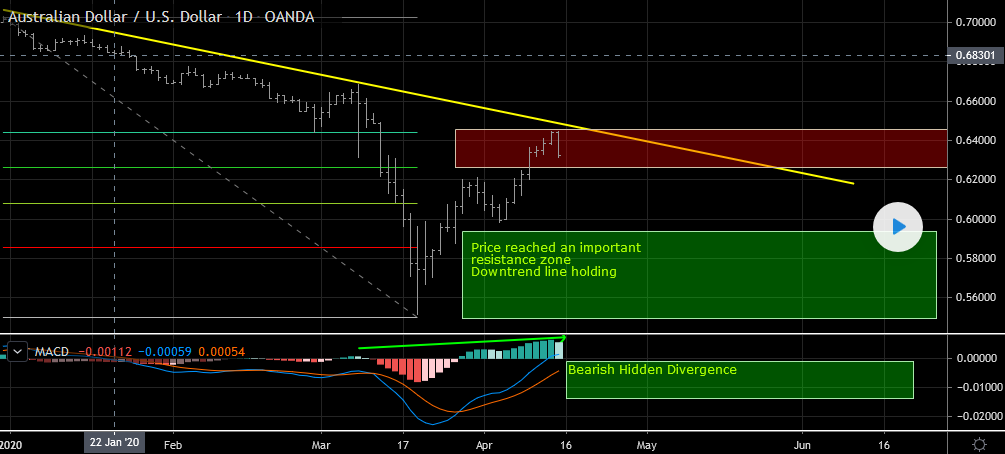
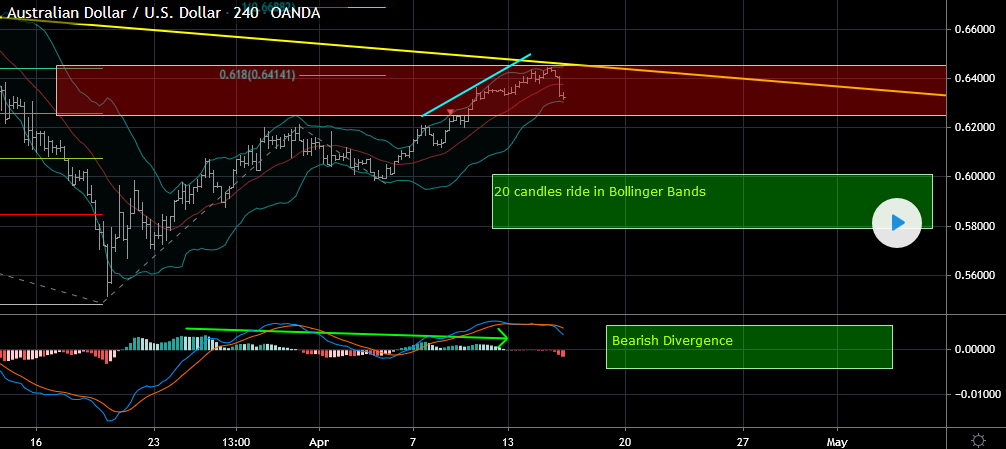
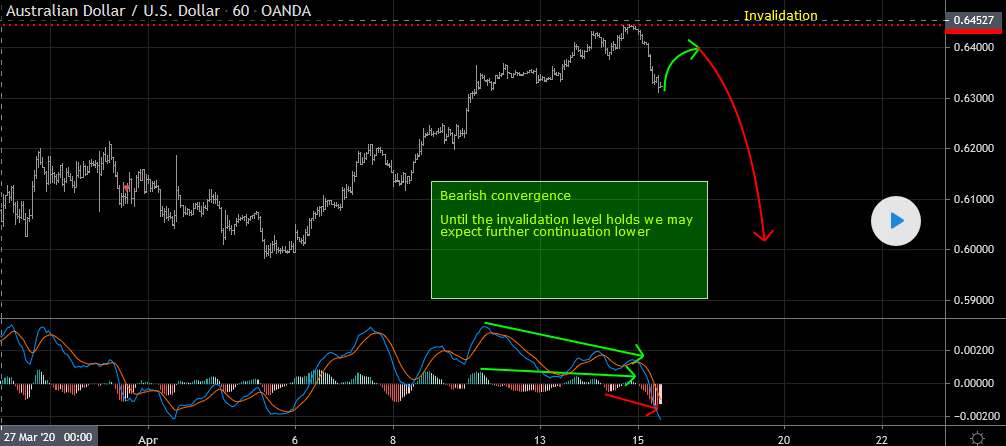
On the daily chart the price has reached an important resistance zone formed by the 50% – 61.8% fibonacci retracement level of the cycle we have and the downtrend line. The price is respecting this resistance zone so far. In addition to this we also have a bearish hidden divergence that has formed based on the MACD histogram indicator which we may consider as an evidence of bearish pressure.
Looking at the H4 chart we can see that it has bearish evidences in the form of 20 candles Bollinger Bands ride and bearish divergence which supports the daily bearish view perfectly. Also while measuring the first wave, the 61.8% fibonacci expansion level coincides with the daily resistance zone which makes this area a very strong resistance zone for us and the price is holding in this zone.
(Note: You can follow me here on Trading View and also on my blog to get similar ideas on daily basis)
Note: Right now with the Corona virus impact the real money flow is not there in the market, a lot of investors and traders are out of the market and are waiting for this crisis to come down. Many traders are sitting on the fence making nothing, what you would see on the market in such period in panics, there are a lot of random fast moves with high volatility, very serious moves, big volumes but these moves are not technical but in such cases its very important to wait for your setups, have your analysis. If the setup comes, trade it and value the risk, if you would be right in high volatility period then once it moves, it moves big and fast but if it doesn’t then you know your risk is limited. Don’t trade without planning your risk its a big mistake.
Watch my video on How to trade during Corona virus Crisis here
For similar trade ideas and much more join the Traders Academy Club and get access to our complete watch list and trade report.
This is how the report looks like. A table with the hottest market opportunities, screenshot behind every pair and time frame (anything that is in blue inside the table is clickable and leads to a screenshot) + a summary in text format, kind of highlights. And of course Live Trading Room every single day.
If you have any further questions, don’t hesitate to drop a comment below!
To your success,
Vladimir Ribakov
Certified Financial Technician
The new trading week presents several high-probability opportunities across the forex and commodities markets. After…
Hi Traders! Arvinth here from the Home Trader Club team. The weekly summary and, review of July…
Hi Traders! UK100 short term forecast and technical analysis is here. We do our analysis…
Hi Traders! CADCHF short term forecast follow-up and update is here. On May 14th 2026…
Hi Traders! EURNZD short term forecast and technical analysis is here. We do our analysis…
Hi Traders! AUDCAD short term forecast update and follow up is here. On May 12st…
View Comments
Thank you, finding it too useful
Thanks for the update, will follow