Hi Traders! NZDCAD short term forecast update and follow up is here. On June 2nd, 2026 I shared this “Forex Market Analysis & Day Trading Opportunity | NZDCAD| 2 June 2026” post in our blog. In this post, let’s do a recap of this setup and see how it has developed now. If you would like to learn more about the way we trade and the technical analysis we use then check out the Home Trader Club. Spoiler alert – free memberships are available!
Want to access the tools, systems, and real-time education we use daily?
With AvaTrade Broker’s support, you can now enjoy up to one full year of access to the Home Trader Club — including:
All professional trading systems
Access to our new project, the Home Trader Club trade copier, where our traders trade and you can copy.
Real-time trade ideas and setups
Full access to our course library and trading marketplace
My Idea
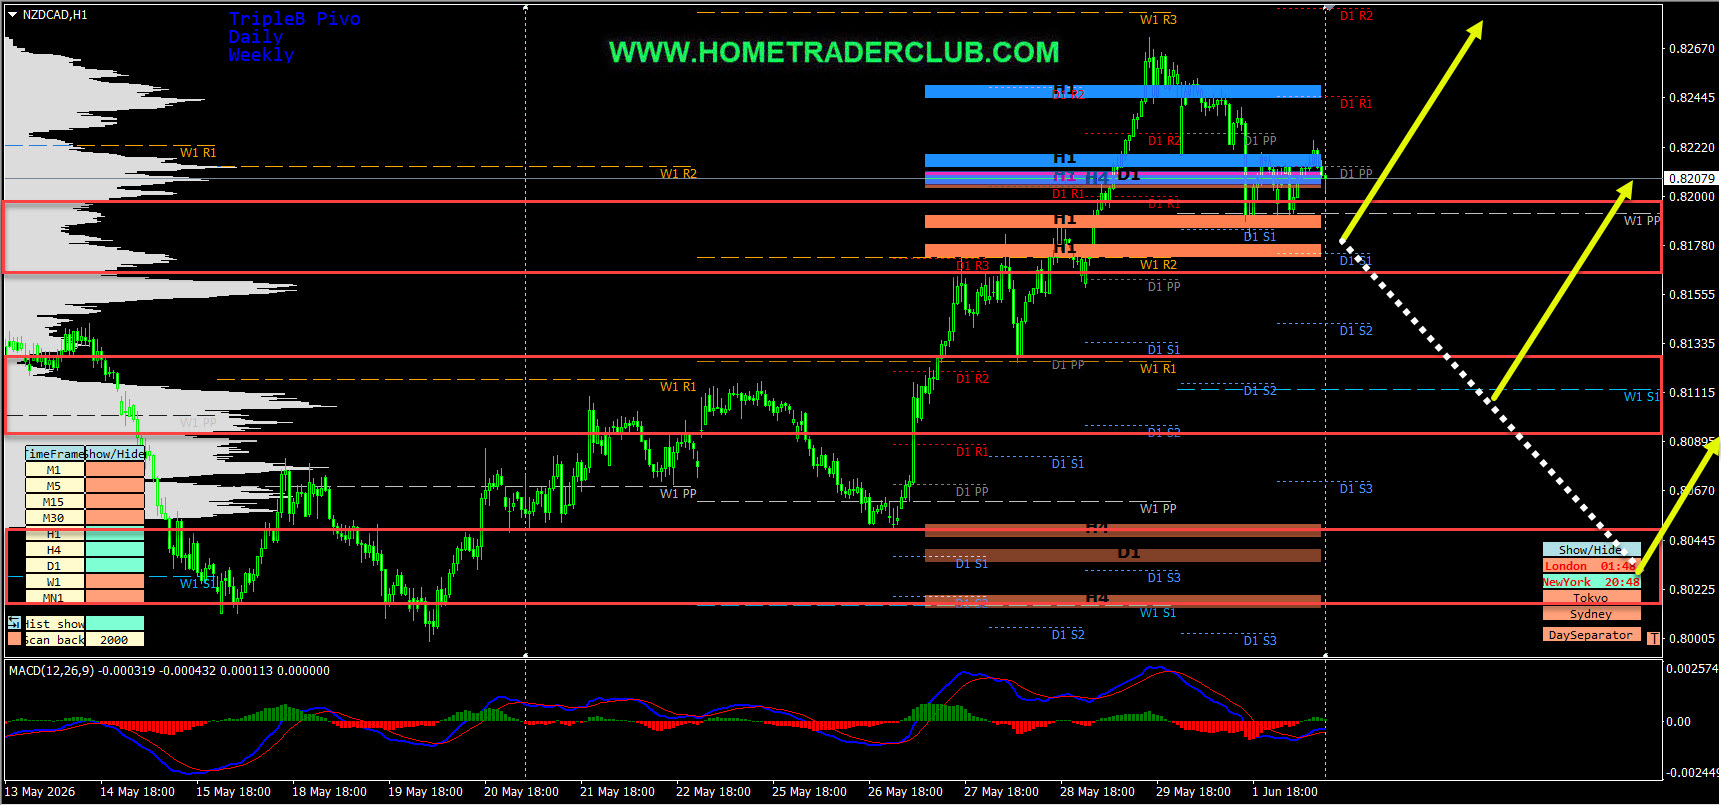
On the H1 chart, we have a strong bullish momentum and also currently it looks like a correction is happening. So everything looks good for the bulls here as well. In addition to this, we have three key support zones that has formed based on the volume profile zones of the KTLI indicator and the Triple B Pro pivot levels. Until these three key support zones shown in the image below (marked in red) holds my short term view remains bullish here and I expect the price to move higher further after retraces.
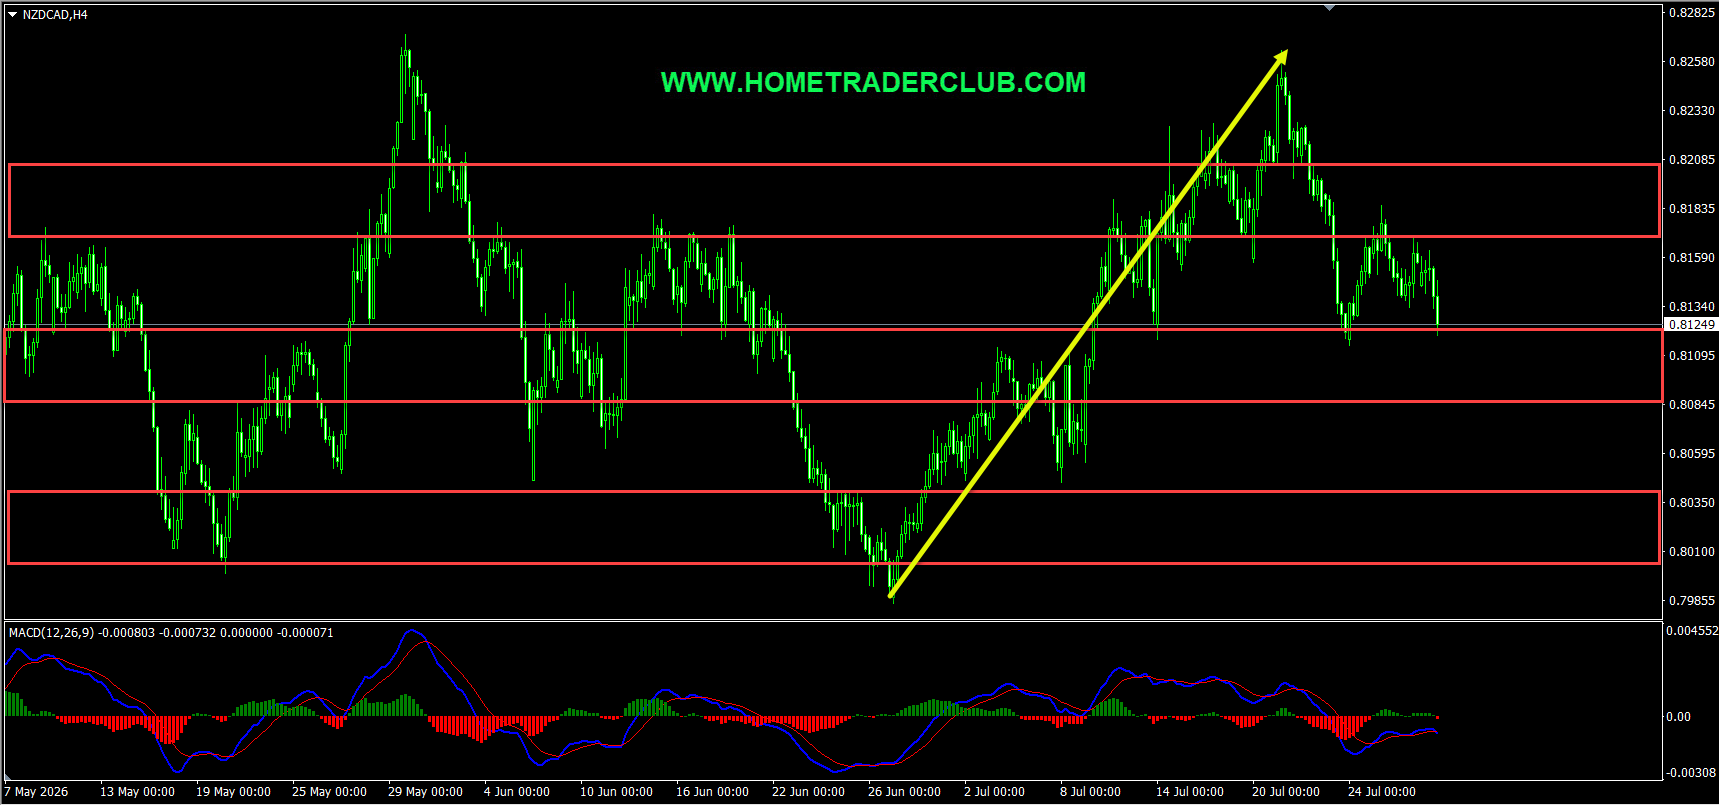
In NZDCAD, based on my technical analysis I mentioned that “Until both the three key support zones shown in the image below holds my short term view remains bullish here and I expect the price to move higher further after pullbacks”. The price action followed my analysis exactly as I expected it to here. The price which was moving lower reached the third key support zone, created a false break of it and then moved higher from this zone. The price then moved higher further and delivered 280+ pips move to the upside!
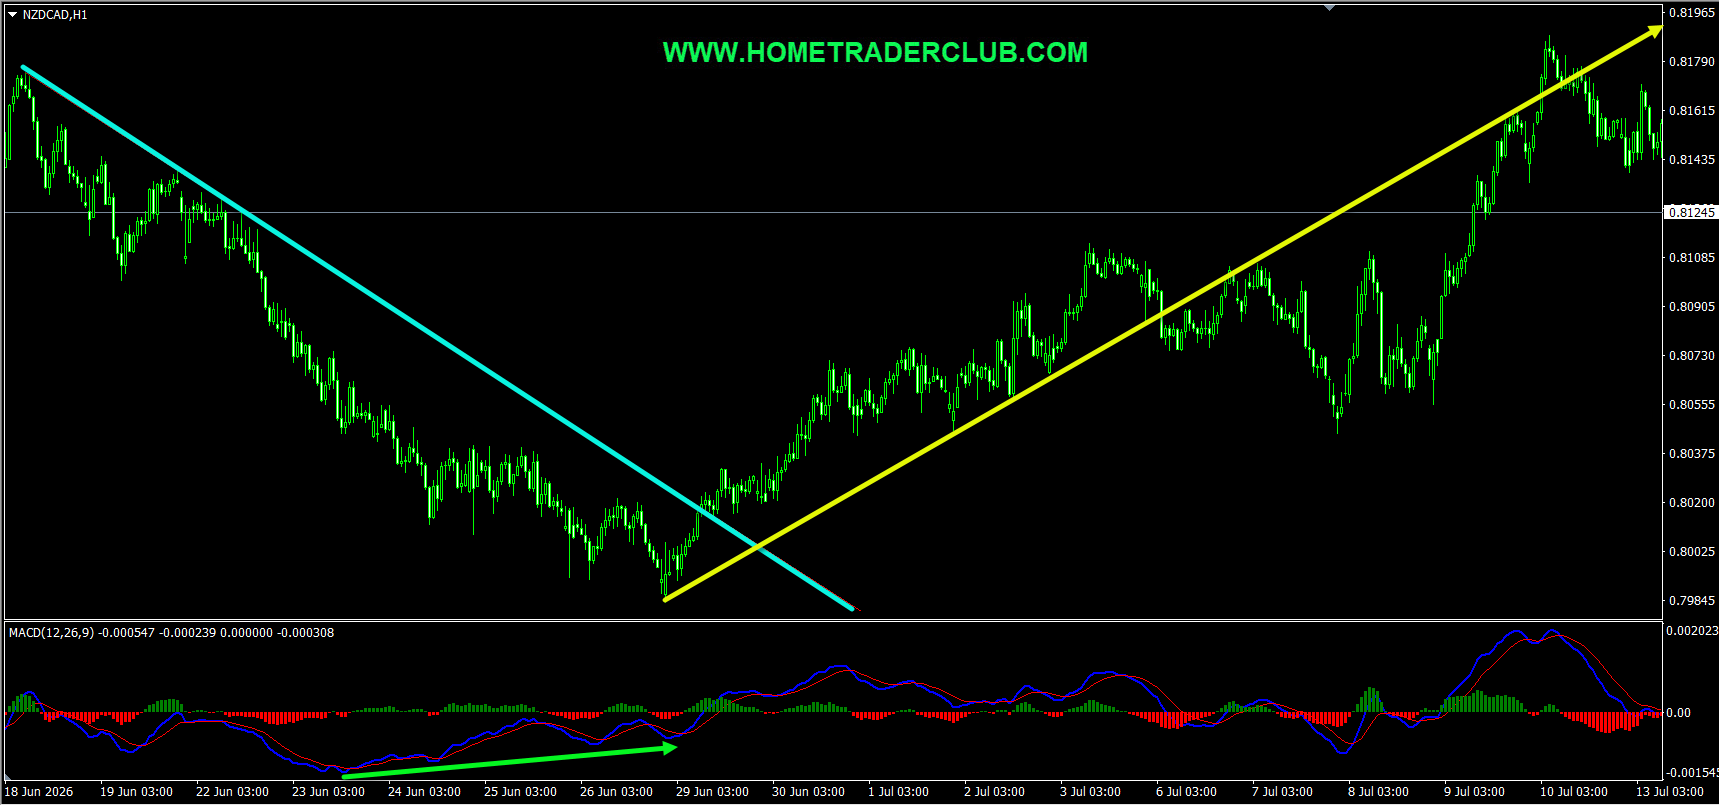
On the H1 chart, the market provided us with various facts supporting the bullish view. The price which was moving lower created a bullish divergence between the first low that has formed at 0.80448 and the second low that has formed at 0.79838 based on the MACD indicator. The price then moved higher and broke above the most recent downtrend line, we may consider these as facts provided by the market supporting the bullish view. Then as you can see in the image below how the price moved higher after that and provided a fantastic move to the upside!
So, traders, this is why I wanted to show this example to help you understand how important it is to follow the facts. The facts were supporting the bullish view here and there were no signs against it. When the facts do happen as we expected you can see how the price perfectly moved as per the plan. Because these are the kind of hints the market provides us with the majority of the time and it’s our obligation as traders to be able to listen to these things that the market tells us and we should try to make the right actions accordingly.
For similar trade ideas and much more I invite you to
Also, you can get one of our strategies free of charge. You will find all the details here
Download our best forex indicators here
If you have any further questions, don’t hesitate to drop a comment below!
Happy Trading!
Arvinth Akash
Home Trader Club Team.
Welcome back to our weekly Forex forecast at Home Trader Club. This week, we are…
GDP growth is one of the most important indicators of economic health. But does stronger…
When it comes to fundamental Forex analysis, few institutions matter as much as the Federal…
Interest rates are one of the most important fundamental forces in the Forex market. But…
The latest U.S. employment report has delivered a significant warning for the market. With only…
The Forex market does not always offer clear trading opportunities. Sometimes, price moves sharply in…