Guest Post by Nicola Delic
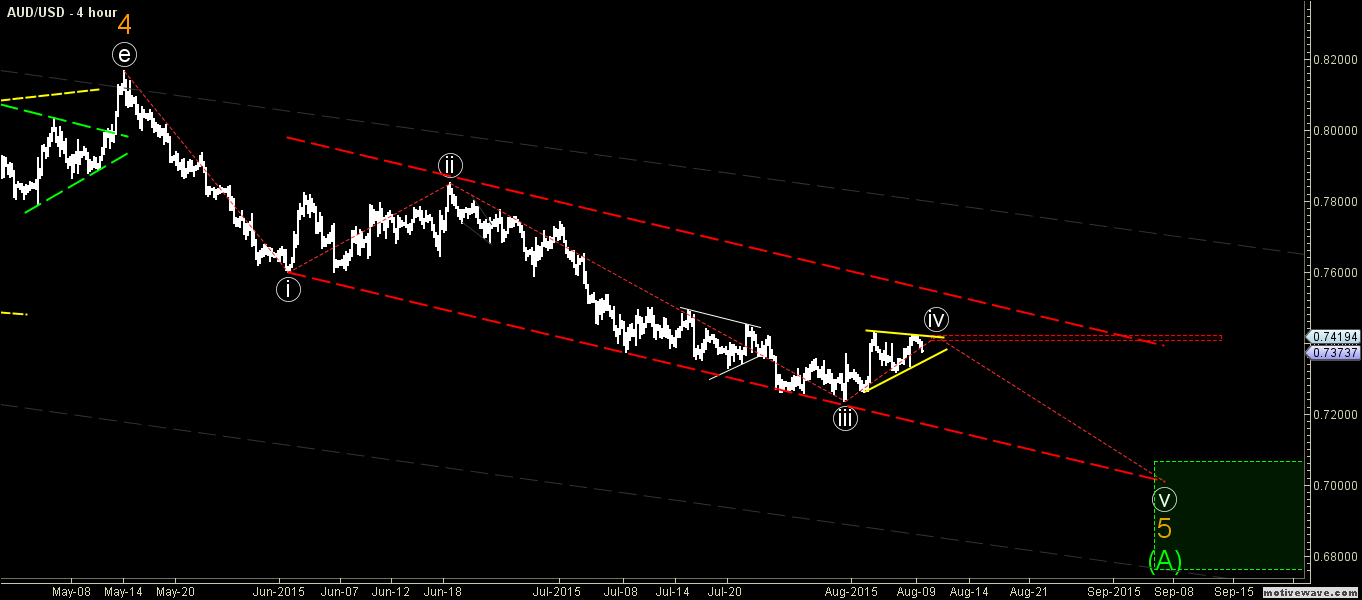
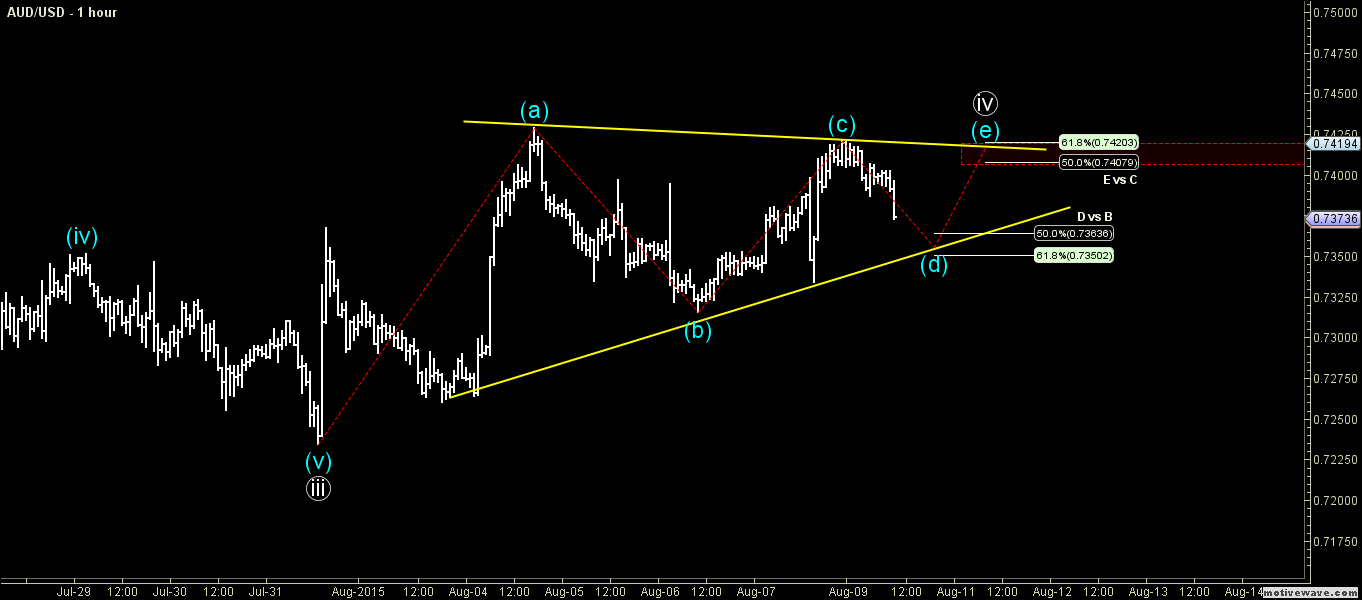
The Aussie Dollar looks like forming a breakout pattern on the hourly chart versus the US Dollar, as there is a triangle pattern created. Moreover, it looks like the AUDUSD pair might complete 5 waves inside the triangle to set it up for a break lower. There are chances that the pair might head lower if it manages to settle below the triangle support area. If that happens, then the pair might head towards the 0.7000 handle in the near term.
In order to enter a sell trade I think we should wait for the AUDUSD pair to break and settle below the triangle support area.
Technical Analysis
H4– Chart representing the possibility of the AUDUSD pair heading towards 0.7000.
Entry:
H1– We can enter a sell trade once the AUDUSD pair breaks and settles below the highlighted triangle pattern.
Target 1: 0.7250
Target 2: 0.7180
Stop Loss: Above 0.7420
Video Explanation
Hi Traders! Arvinth here from the Home Trader Club team. The weekly summary and, review of July…
U.S. stock indexes hit multi-week lows on Thursday, as concerns over heavy AI spending resurfaced…
Hi Traders! GBPUSD short term forecast and technical analysis is here. We do our analysis…
Hi Traders! Ethereum short term forecast follow-up and update is here. On May 26th, 2026…
Hi Traders! GBPAUD short term forecast and technical analysis is here. We do our analysis…
Hi Traders! USDCHF short term forecast update and follow up is here. On May 20th,…
View Comments
Great post.