I think cable is a great opportunity to follow during the next week. Please keep in mind though that there is FOMC meeting on Thursday which may cause zig zags, ranges and false breaks. The plan is very simple. We can clearly see the potential double wave duplication on the H4 chart. There is also bollinger band duplication around the same place, on the Daily chart, as well as down trend line. I will be looking to join the bearish momentum on the H1 chart. Once the most recent up trend line, along with the most recent support level are broken down, I will look to short the pair. Since the entry is dynamic our targets are also dynamic. As a first target I will use the H4 chart 20 MA and depending on the entry will decide where the second target will be. Protection should be placed above the broken trend line and the supportive zone.
Technical Overview:
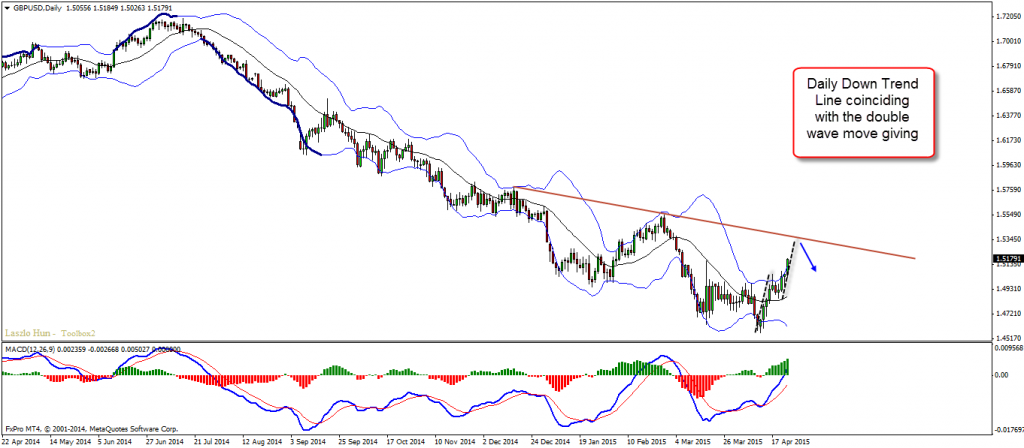
D1 – bollinger bands duplication, down trend line
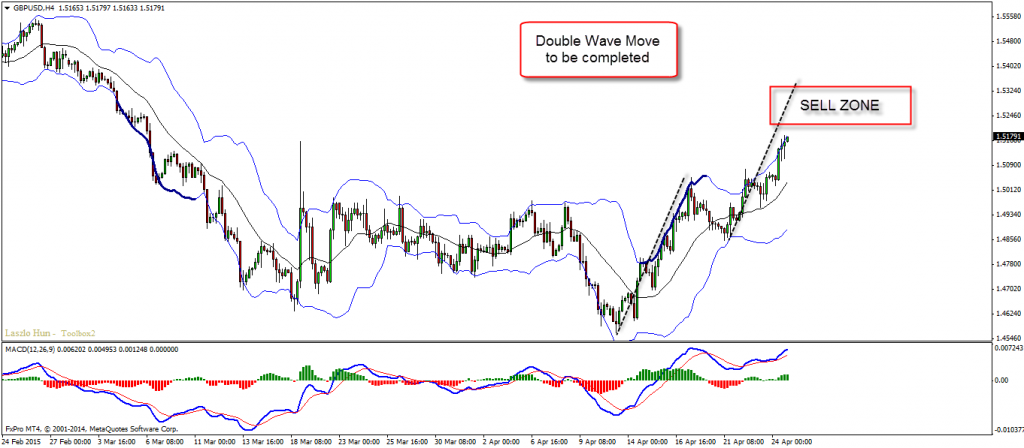
H4 – potential double wave move
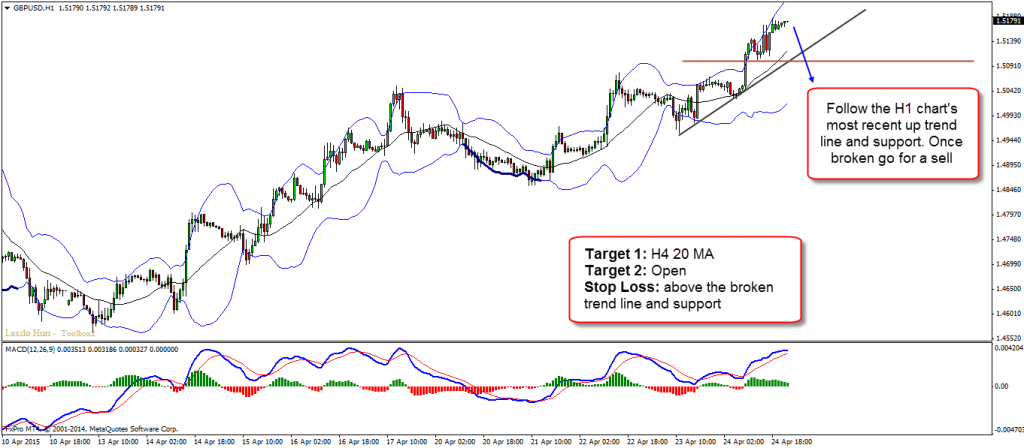
H1 – up trend line
Entry:
H1 – follow the up trend line and the most recent support for a break. Once broken look to sell the pair.
Target 1: H4 20 MA
Target 2: Open
Stop Loss: above the broken trend line and support
Hi Traders! Arvinth here from the Home Trader Club team. The weekly summary and, review of July…
U.S. stock indexes hit multi-week lows on Thursday, as concerns over heavy AI spending resurfaced…
Hi Traders! GBPUSD short term forecast and technical analysis is here. We do our analysis…
Hi Traders! Ethereum short term forecast follow-up and update is here. On May 26th, 2026…
Hi Traders! GBPAUD short term forecast and technical analysis is here. We do our analysis…
Hi Traders! USDCHF short term forecast update and follow up is here. On May 20th,…