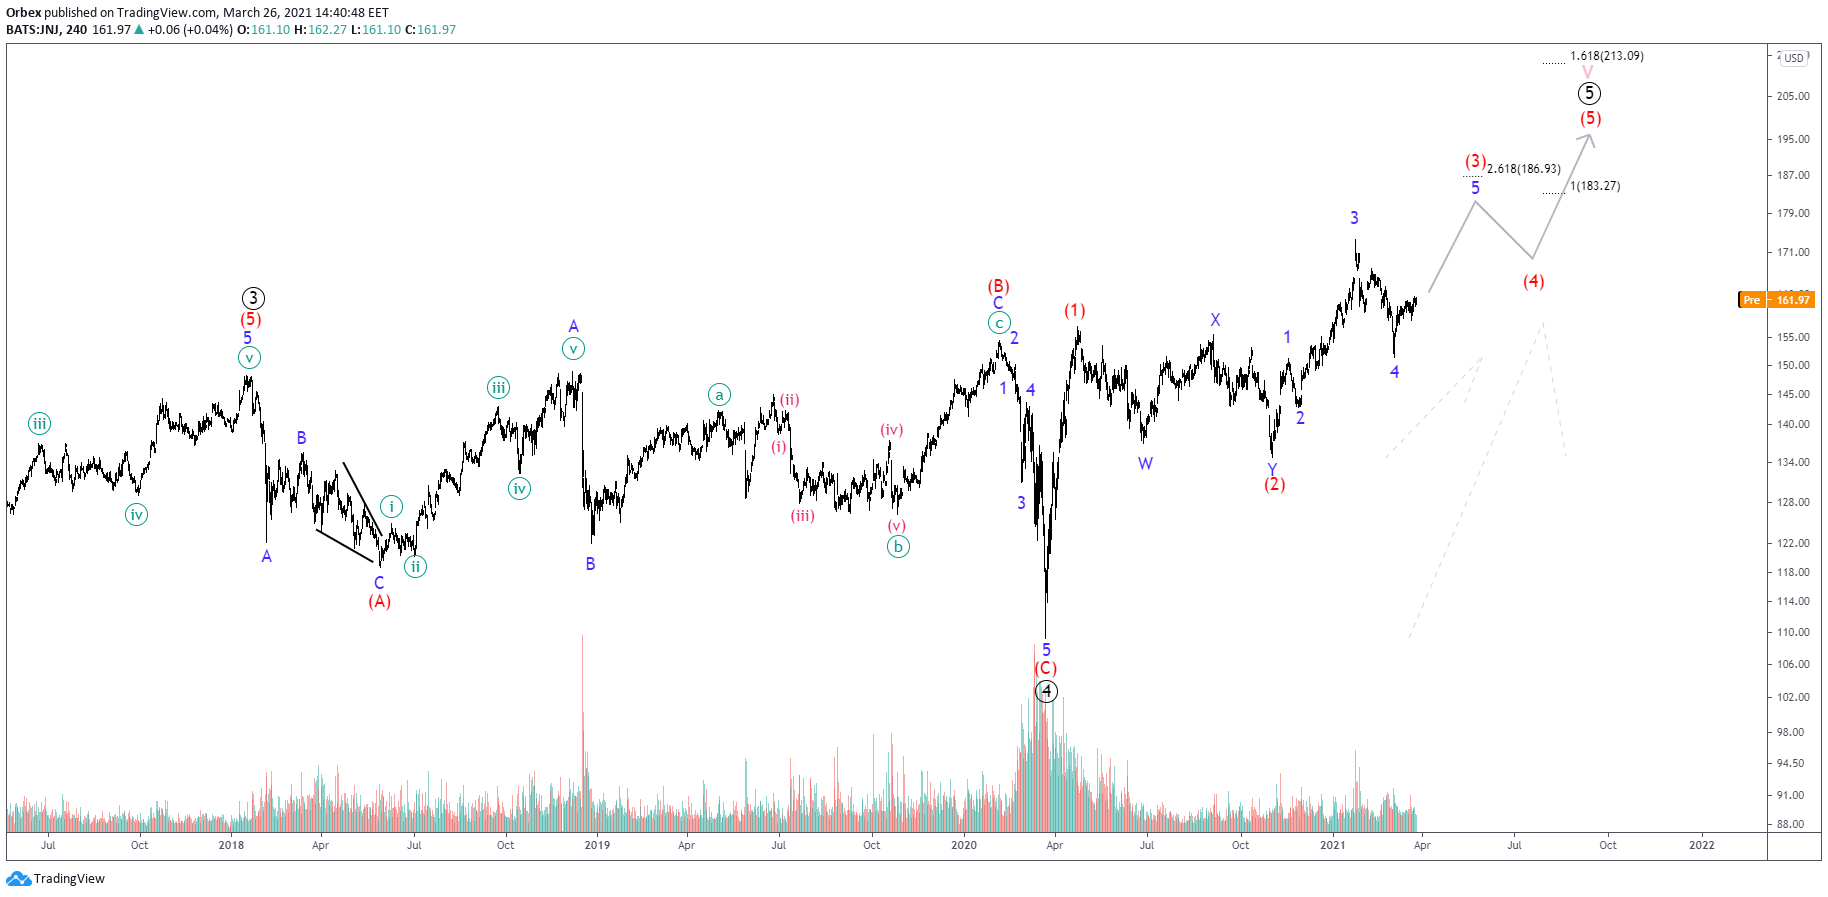
Johnson and Johnson stock price is expected to maintain a bullish bias, running a 5th wave of an ending diagonal that could reverse around $190.
Following the completion of an expanding flat pattern in primary wave ④, a solid recovery from the lows of $108 back in Apr 2020 was seen boosting prices up by nearly 60%. However, the corrective structure seen since the first correction in intermediate wave (2) – ie intermediate wave (3), hints at a motive, albeit non-impulsive, pattern. And this points at an impeding trend reversal, especially since the main scenario indicates we are already in its final stage after the completion of wave (4).
With 5th waves often adopting an ending diagonal formation, the main scenario suggests an end to the bullish profile below the projected market top due to the length of wave (3). As the EWrule says, 3rd waves can never be the smallest waves in a 5-wave move, which means that the break of the 100% Fibonacci expansion of (2)-(3)-(4) would invalidate the particular structure.
5-wave Internal Structure Adds Alternative Bias
Since intermediate wave (3) has to be bigger than (1) or (5) -or it can be bigger than both, the same wave (3) guideline can be applied on this alternative scenario; wave (3) would have to end above $183 as this is the 100% Fibonacci expansion of waves (1)-(2). Despite not knowing wave (5)’s length at this early stage, it is often preferred that wave (3) is at least equal or larger than wave (1) so that wave (5) does not invalidate the impulse.
A break above $187 could generate a short-term correction in intermediate wave (4) and then complete its course up to $213, which happens to be the 161.80% Fibonacci expansion of waves (1)-(2).
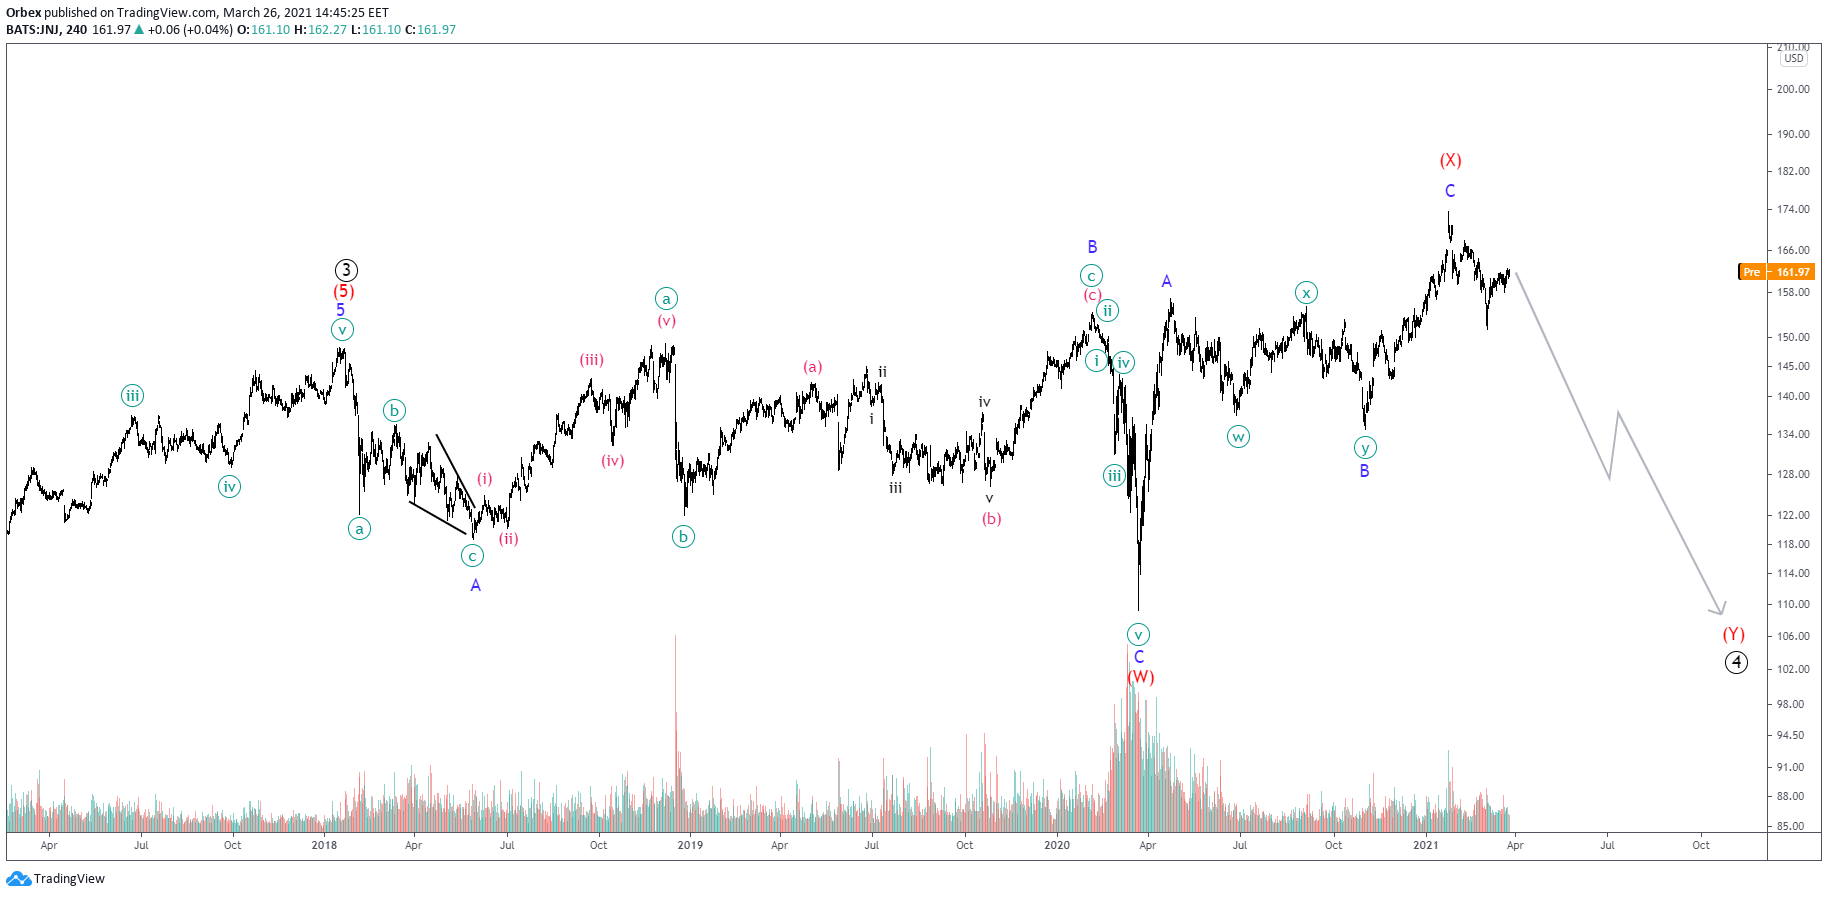
Without a Fresh High We Are More Likely to Crash
In such a scenario we won’t be concerned with identifying a higher reversal top but only with where the correction ends as we would be still in primary wave ④. Its end could be near last April’s low as we would be facing a double three structure.
With wave (W) producing an expanding flat as in the main scenario and wave (X) completing a simple zigzag above the high of wave (W), wave (Y) could either turn out forming a 5-wave impulse for a complex flat or, yet another corrective pattern. Otherwise, look for a fresh high before any of the latter two scenarios might play out.
About the Author
You can follow Stavros on Twitter and Linkedin here: twitter.com/StavrosTousios & linkedin.com/in/stavrostousios/
Hi Traders! Arvinth here from the Home Trader Club team. The weekly summary and, review of July…
European markets edged lower on Thursday following more overnight volatility in Asia’s tech-dominated indexes, while…
Hi Traders! EURGBP short term forecast and technical analysis is here. We do our analysis…
Hi Traders! Bitcoin short term forecast update and follow up is here. On May 7th,…
Hi Traders! AUDJPY short term forecast and technical analysis is here. We do our analysis…
Hi Traders! Oil short term forecast and technical analysis is here. We do our analysis…