Hi Traders! Weekly Summary And Review March 26th, 2021 is here. It is now time to recap and summarize the trade setups that we had during this week. Below you will find the short explanation of all the trade setups we had in this week and how it has currently developed now.
First, we will see the trade ideas that I shared in my blog:
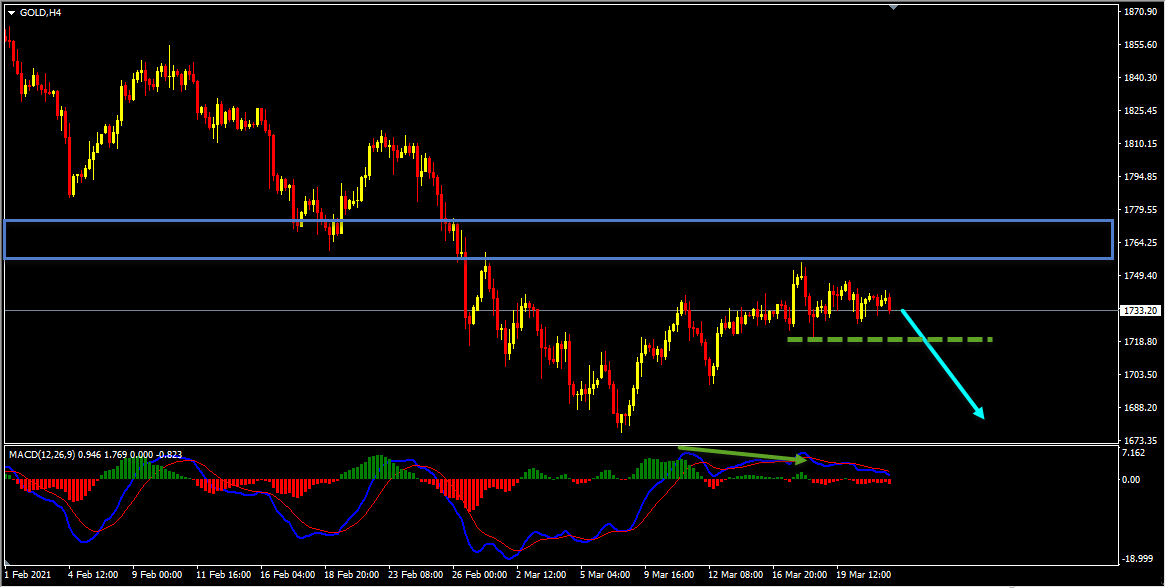
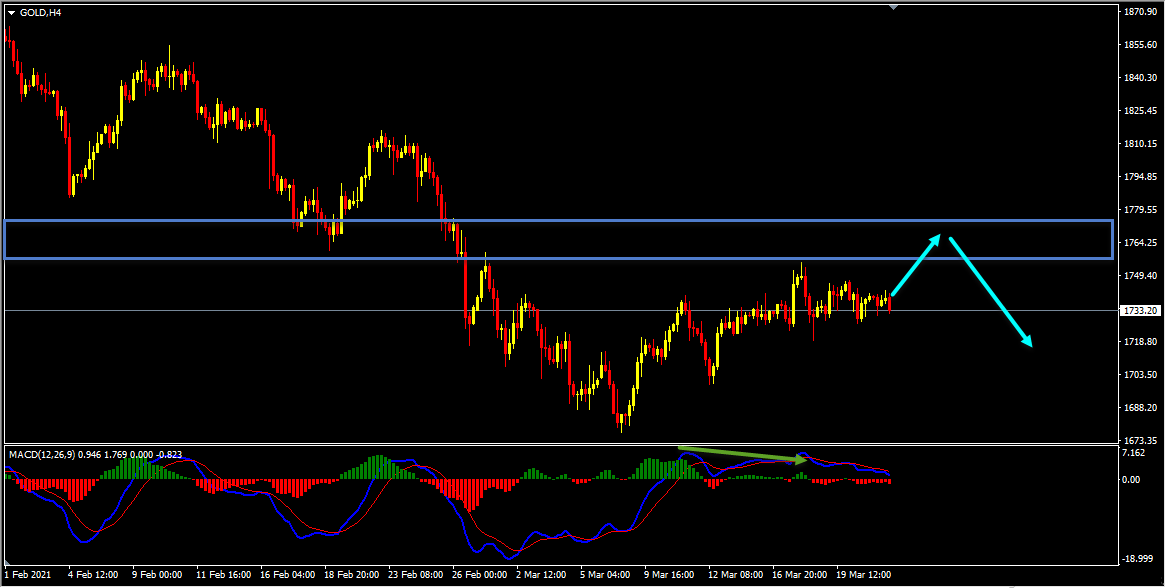
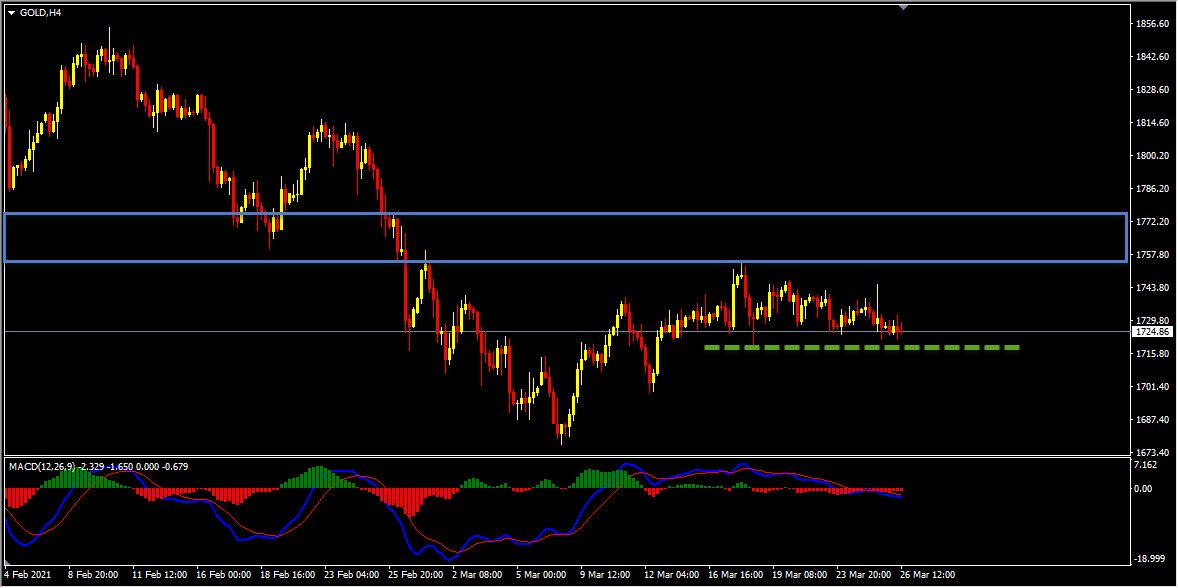
Gold – My idea here was “On the H4 chart, we had a strong support zone that has formed and the price which is moving lower has broken below this zone and is holding below it. Currently, this strong support zone is acting as a strong resistance zone for us. Until this strong resistance zone holds my view remains bearish here and I expect the price to continue lower further. Currently, it looks like the daily correction is happening in the form of double wave to the upside on the H4 chart. In addition to this, we have a bearish divergence that has formed between the first high that has formed on 11th March 2021 and the second high that has formed on 18th March 2021 based on the MACD indicator, we may consider this as evidence of bearish pressure. There are two possible scenarios from here which are as follows:
Scenario 1: If the price moves lower from the current zone and if we get a valid breakout below the low at 1719.21, we may then consider it as evidence of bearish pressure and may expect the price to move lower further.
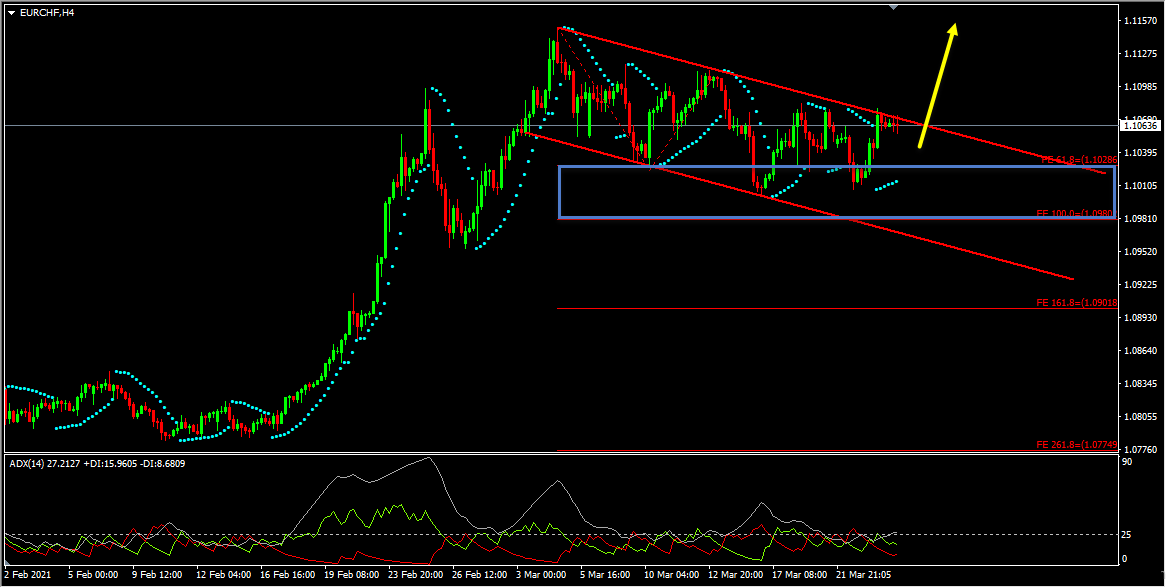
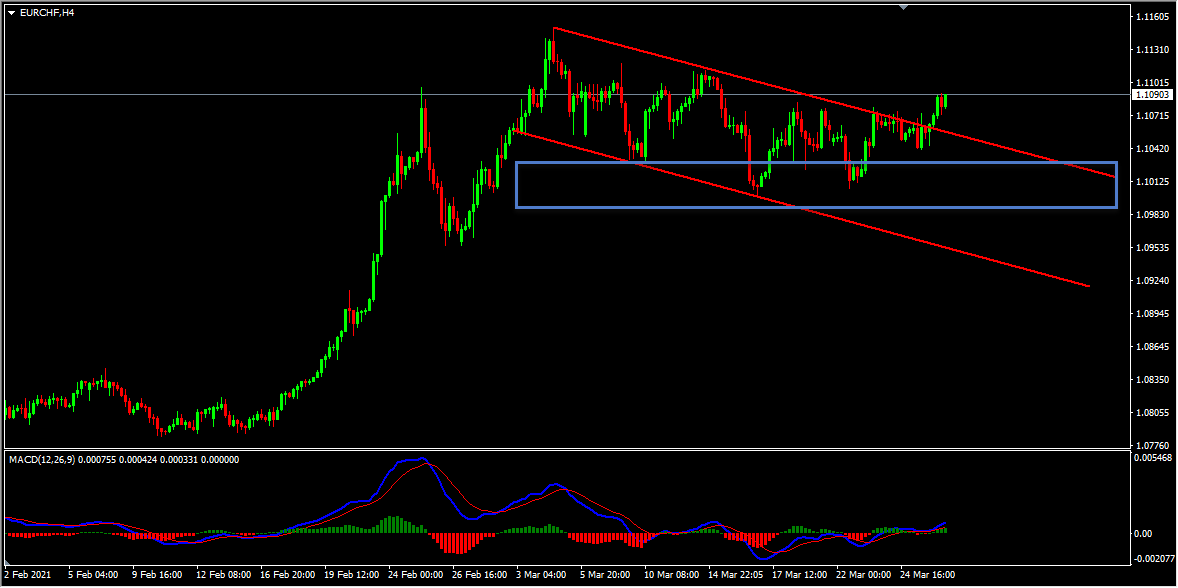
EURCHF – My idea here was as “Looking at the H4 chart we could see that the daily correction is happening in the form of a range. This range is formed by the highs and lows reaching parallel support and resistance zones. The price which is moving inside this range reached a key support zone formed by the 61.8%(1.10286), 100%(1.09802) Fibonacci expansion level of the first wave, and the bottom of this range. The price respected this key support zone and bounced higher from this zone. Also the ADX indicator gave a bullish signal at the cross of +DI (green line) versus -DI (red line) and the main signal line (silver line) reads value over 25, we may consider this as evidence of bullish pressure. The price is currently at the top of this range, if we get a valid breakout above the top of this range, we may then consider it as a validation for the bullish view and may expect the price to move higher further”.
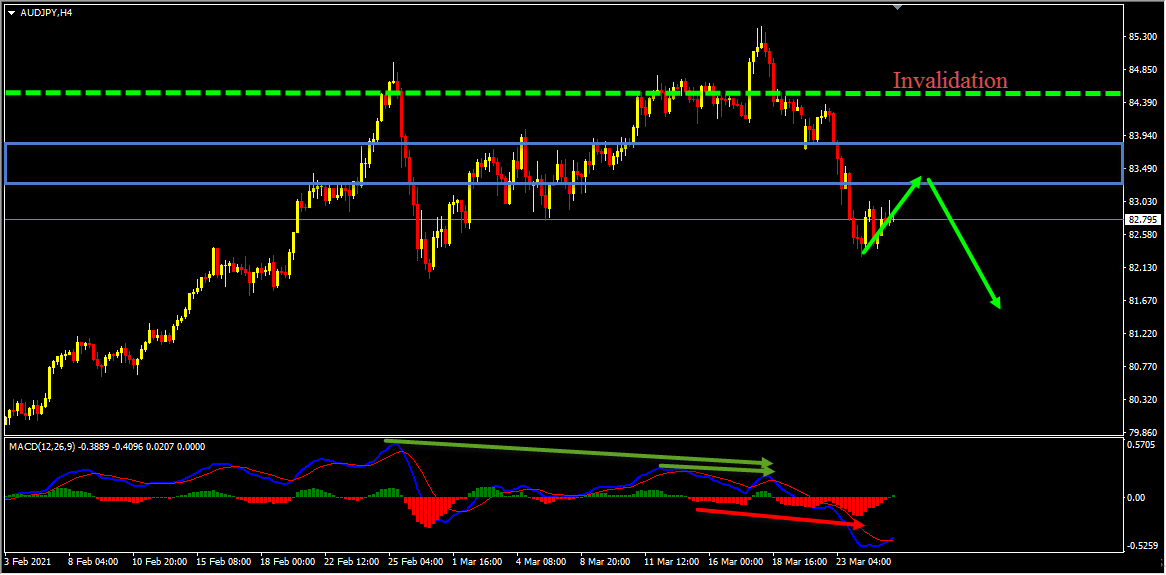
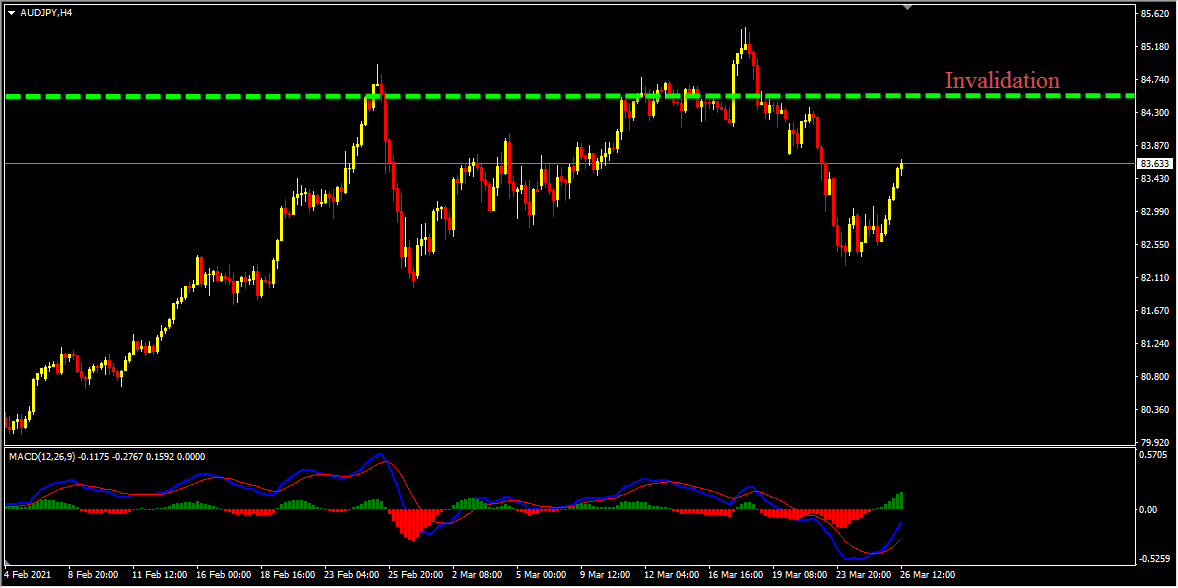
AUDJPY – My idea here was “On the H4 chart, the price has created a bearish divergence between the first high that has formed at 84.940 and the second high that has formed at 85.440 based on the MACD indicator. We also had another bearish divergence between the first high that has formed at 84.767 and the second high that has formed at 85.440 and then the price moved lower and broke below the low at 84.107 creating lower lows, thus forming a classical setup of bearish divergence followed by bearish convergence. Hence as per the book scenario, after a bearish convergence, we may look for possible corrections and then further continuation to the downside. Currently, it looks like the correction that we are looking for is happening. Also, we have a strong support zone that has formed and the price which is moving lower has broken below this zone and is holding below it, we may consider this as another evidence of bearish pressure. Currently, this strong support zone is acting as a strong resistance zone for us. Until the invalidation level (marked in green dotted line) holds my view remains bearish here and I expect the price to continue lower further after correction”.
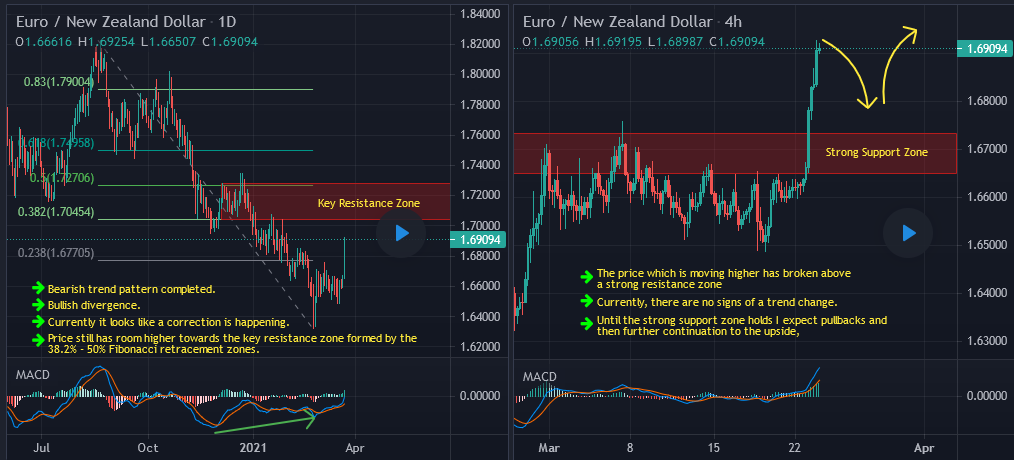
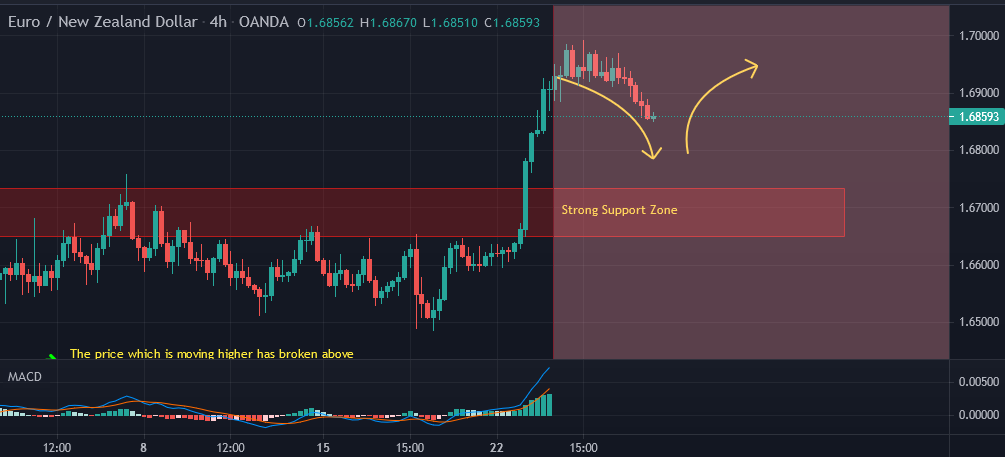
EURNZD – My idea here was as follows:
Current Scenario – My plan didn’t change here, on the H4 chart currently it looks like the pullback that I was looking for is happening. Until the strong support zone holds I expect the price to move higher further after this pullback.
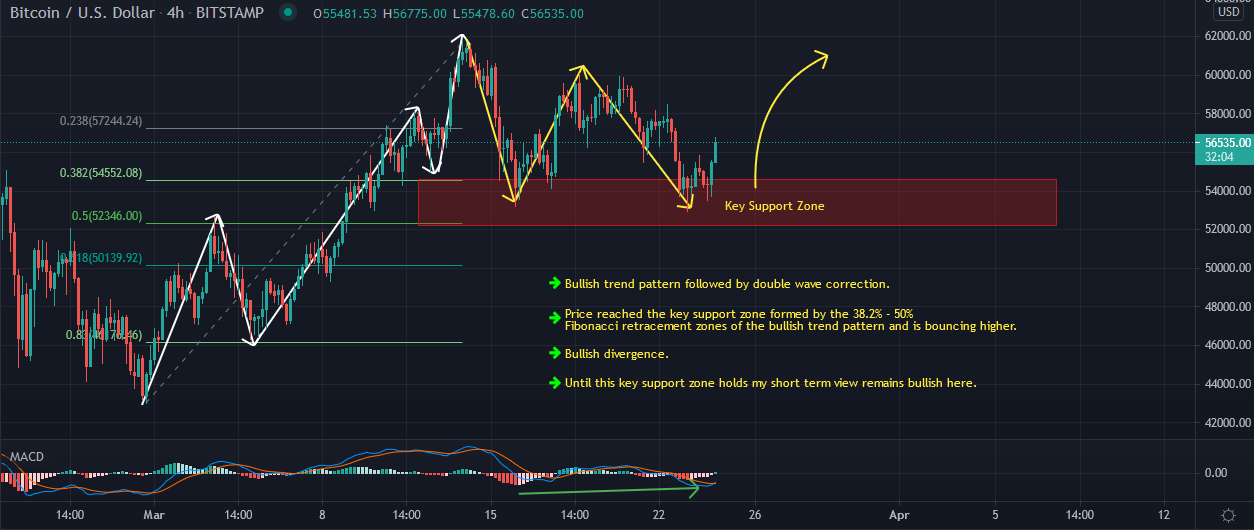
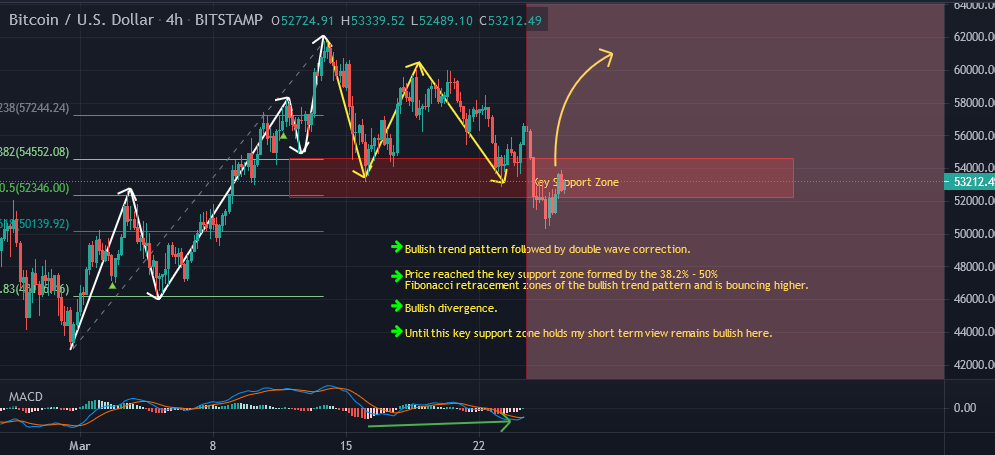
Bitcoin – My idea here was as follows:
Current Scenario – In this buy idea I mentioned that “Until the key support zone holds I expect the price to move higher further”. This idea failed as the price moved lower and broke below the key support zone in the form of a bearish trend pattern creating three lower highs, lower lows. My current view on Bitcoin is neutral.
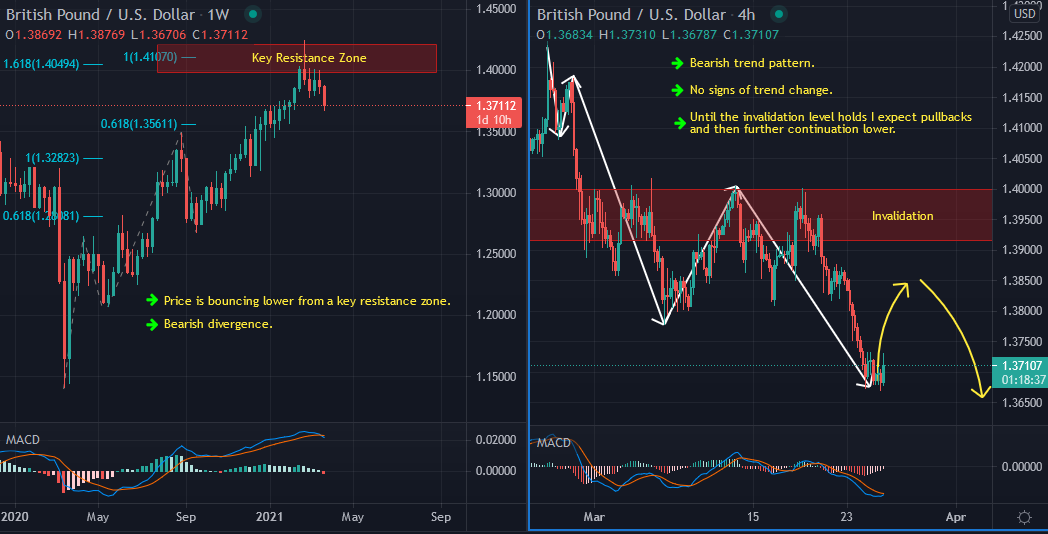
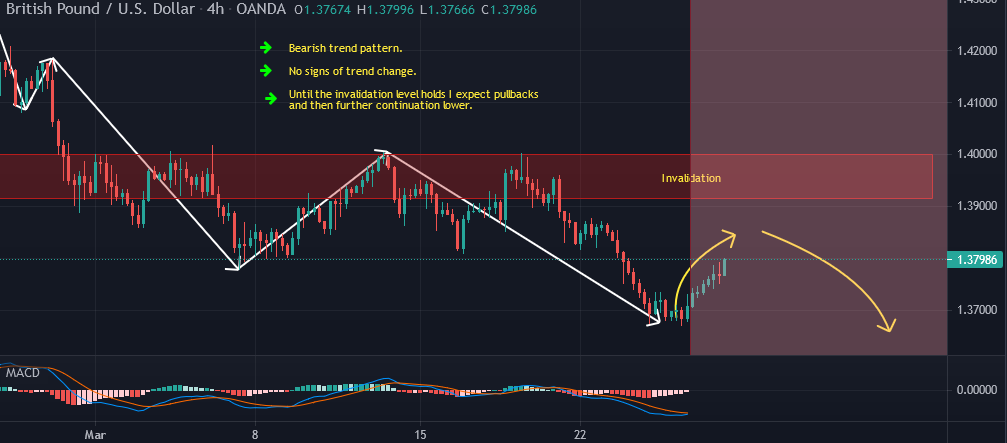
GBPUSD – My idea here was as follows:
Current Scenario – My plan here was to look for correction and then further continuation lower. Currently it looks like the correction is happening, until the invalidation zone holds my plan remains the same here.
Note: You can follow me here on Trading View and also on my blog to get similar ideas on daily basis)
For similar trade ideas and much more join the Traders Academy Club and get access to our complete watch list and trade report.
This is how the report looks like. A table with the hottest market opportunities, screenshot behind every pair and time frame (anything that is in blue inside the table is clickable and leads to a screenshot) + a summary in text format, kind of highlights. And of course Live Market Analysis every single day.
If you have any further questions, don’t hesitate to drop a comment below!
To your success,
Vladimir Ribakov
Certified Financial Technician
Hi Traders! Arvinth here from the Home Trader Club team. The weekly summary and, review of July…
European markets edged lower on Thursday following more overnight volatility in Asia’s tech-dominated indexes, while…
Hi Traders! EURGBP short term forecast and technical analysis is here. We do our analysis…
Hi Traders! Bitcoin short term forecast update and follow up is here. On May 7th,…
Hi Traders! AUDJPY short term forecast and technical analysis is here. We do our analysis…
Hi Traders! Oil short term forecast and technical analysis is here. We do our analysis…