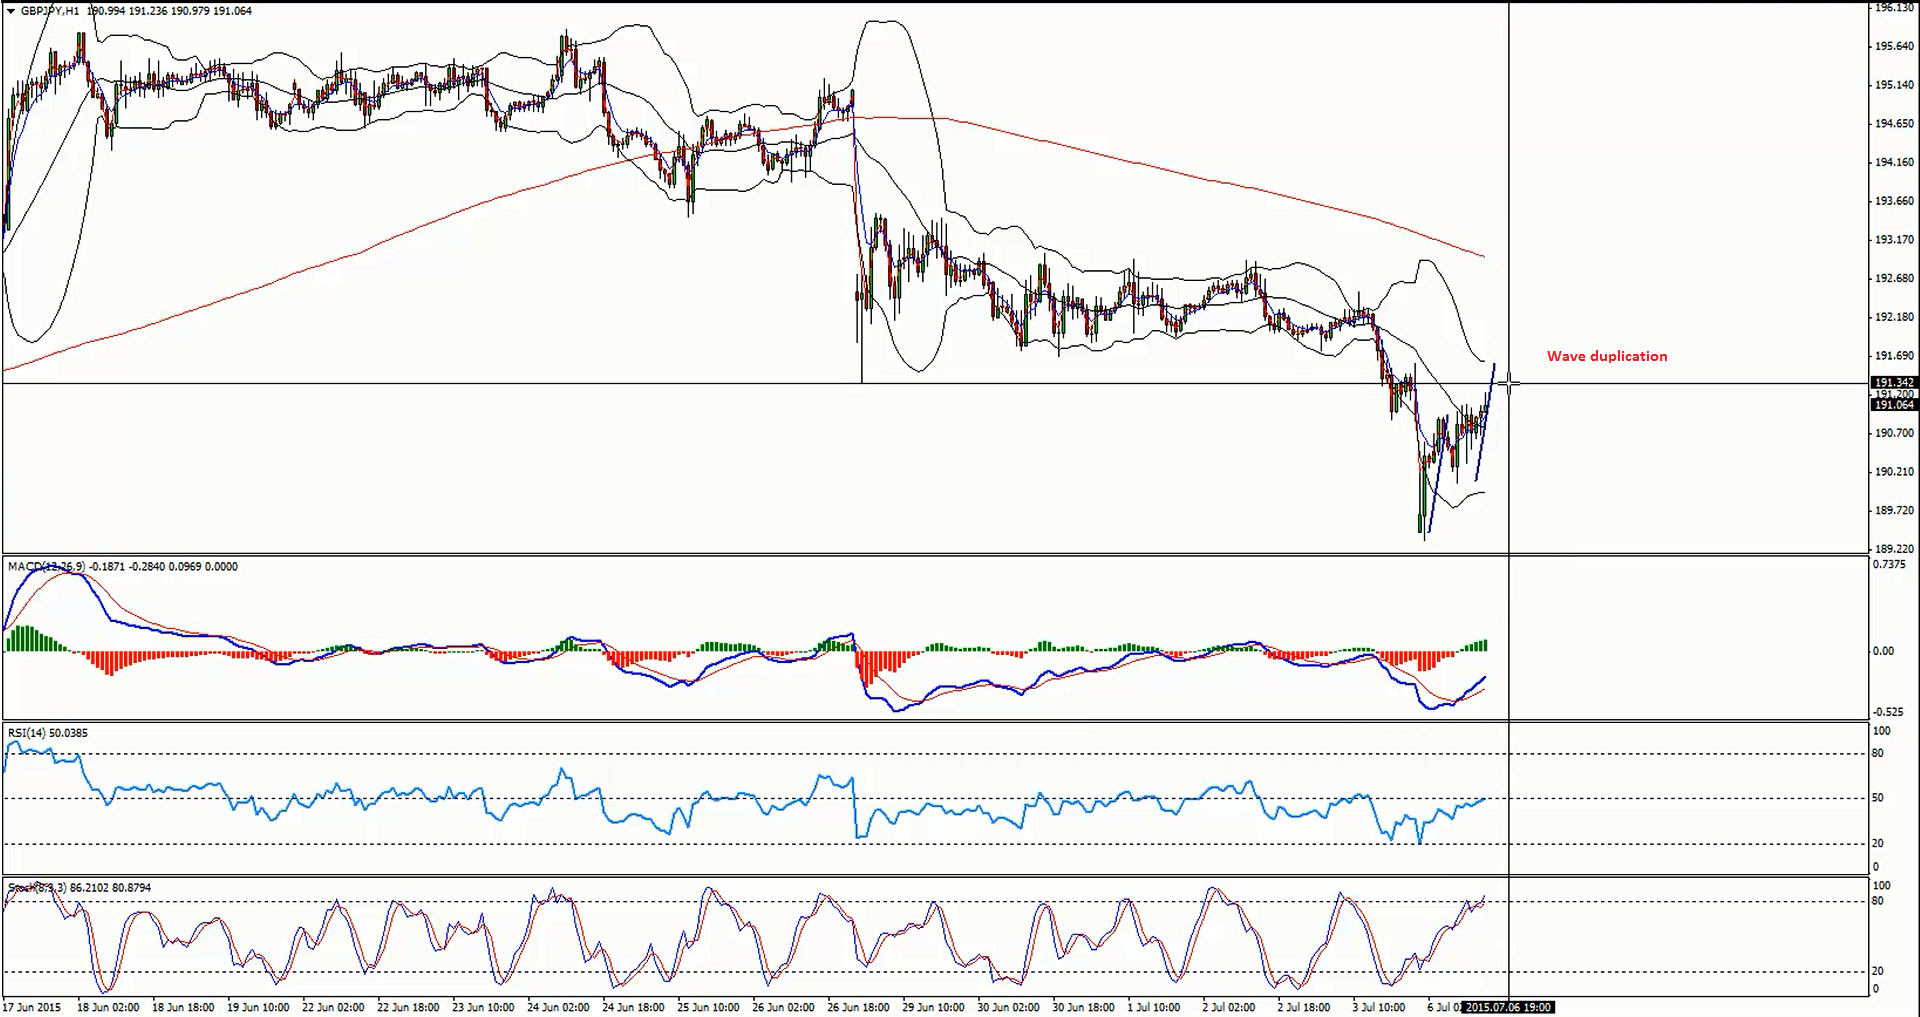
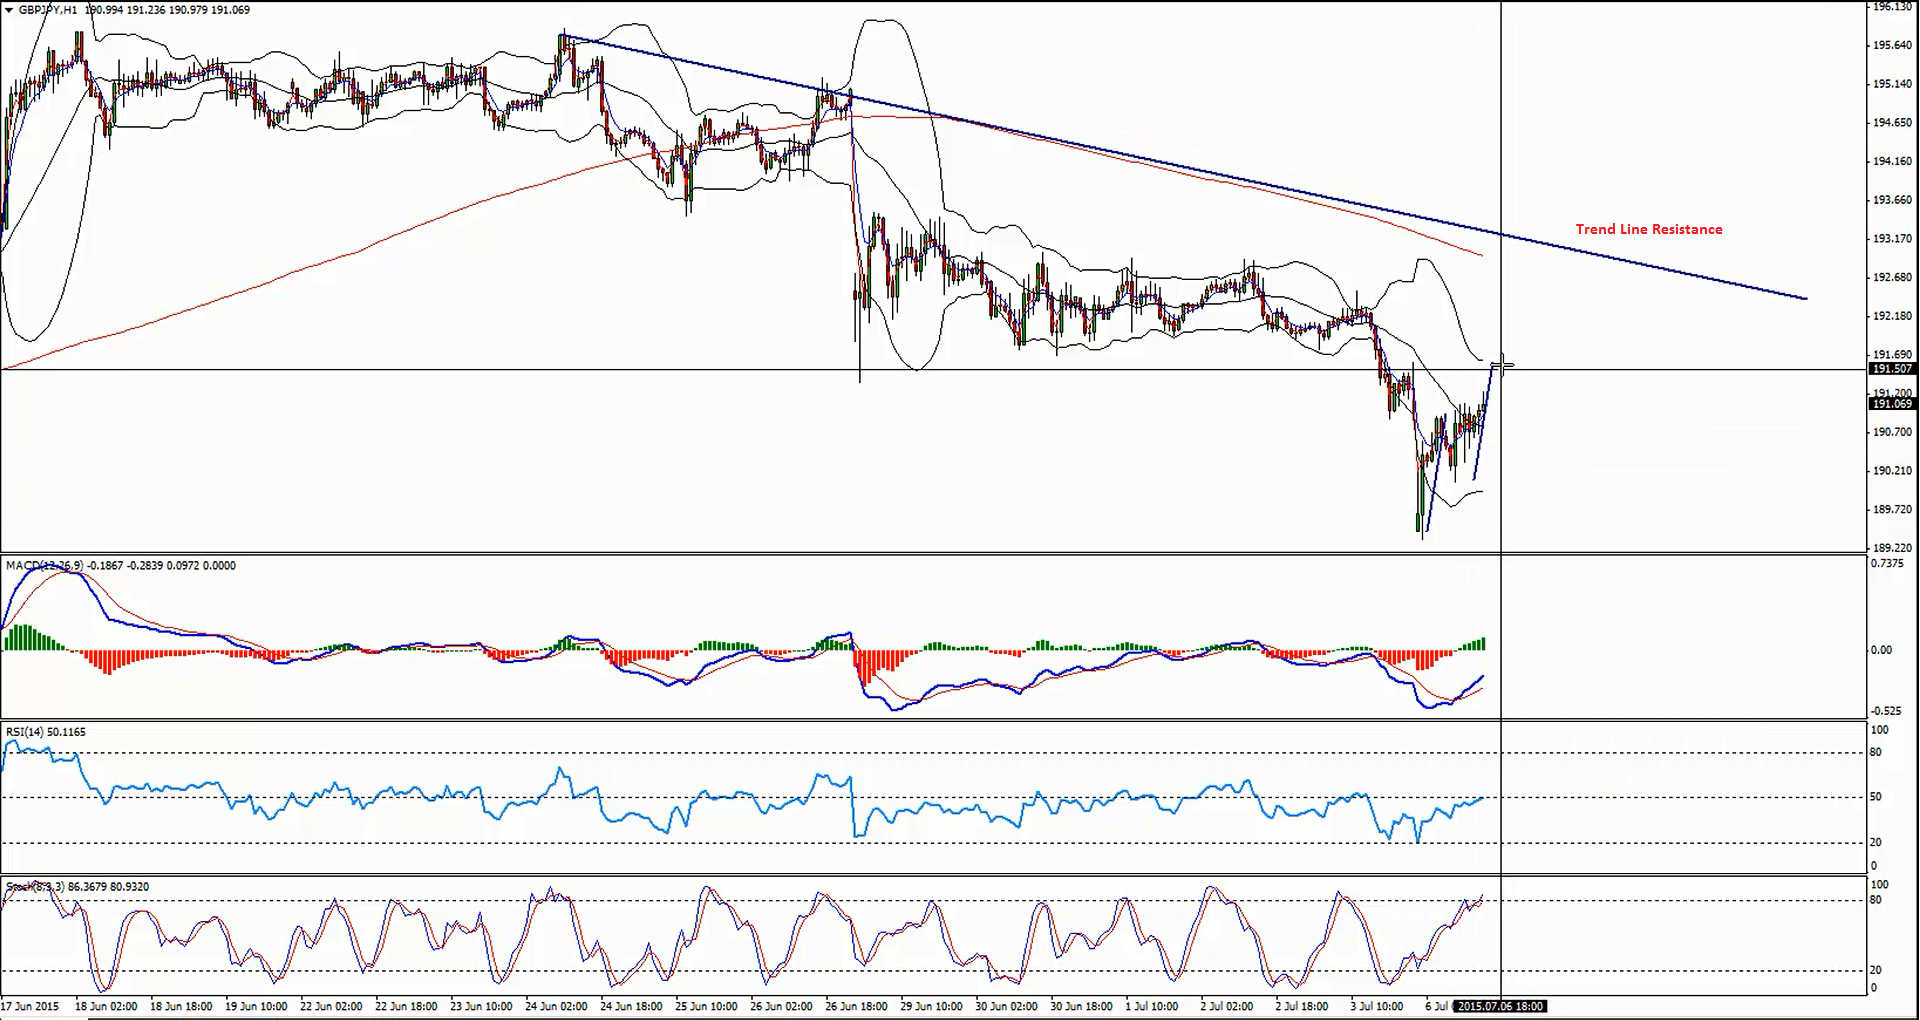
The British Pound suffered losses against the Japanese Yen recently, as the latter one gained traction due to Greece exit fears. The GBPJPY opened with a gap lower, but later managed to close the gap. There is a wave duplication pattern forming on the hourly chart, and there is a bearish trend line formed as well. As long as the pair is below the highlighted trend line we can look for sell opportunities.
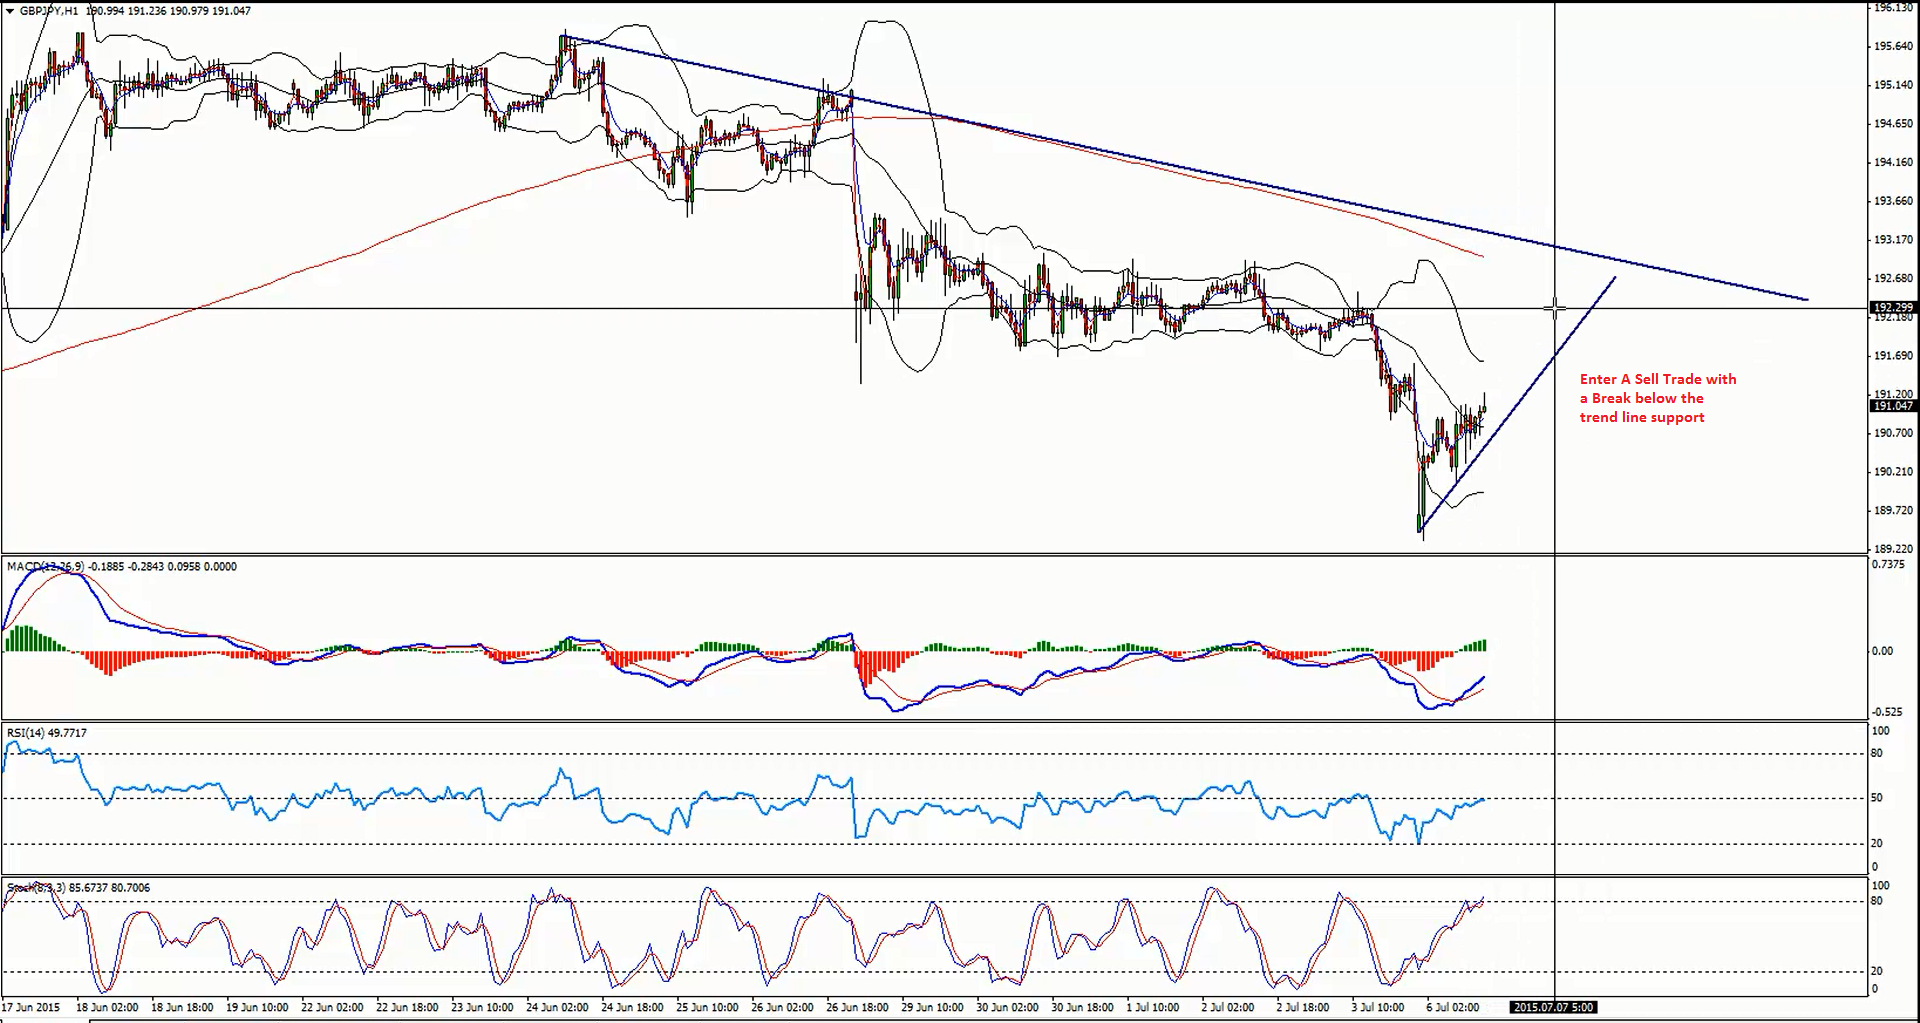
There is a support trend line formed on the hourly chart. If the pair breaks it we can enter a sell trade.
Technical Analysis
H1 – Potential Wave duplication pattern forming on the hourly chart. Bearish trend line that must be respected if the pair has to continue trading lower.
Entry:
H1 – We can enter a sell trade if the GBPJPY pair breaks the highlighted Bullish trend line and settles below it successfully.
Target 1: 189.20
Target 2: 188.50
Stop Loss: Above the bearish trend line on the upside.
Video Explanation:
Hi Traders! Arvinth here from the Home Trader Club team. The weekly summary and, review of July…
U.S. stock indexes hit multi-week lows on Thursday, as concerns over heavy AI spending resurfaced…
Hi Traders! GBPUSD short term forecast and technical analysis is here. We do our analysis…
Hi Traders! Ethereum short term forecast follow-up and update is here. On May 26th, 2026…
Hi Traders! GBPAUD short term forecast and technical analysis is here. We do our analysis…
Hi Traders! USDCHF short term forecast update and follow up is here. On May 20th,…