Hi Traders! GBPUSD forecast follow up and update is here. On April 13th I shared this “Technical Analysis – GBPUSD Forecast” post in our blog. In this post, let’s do a recap of this setup and see how it has developed now. If you would like to learn more about the way we trade and the technical analysis we use then check out the Traders Academy Club. Spoiler alert – free memberships are available!
My Idea:
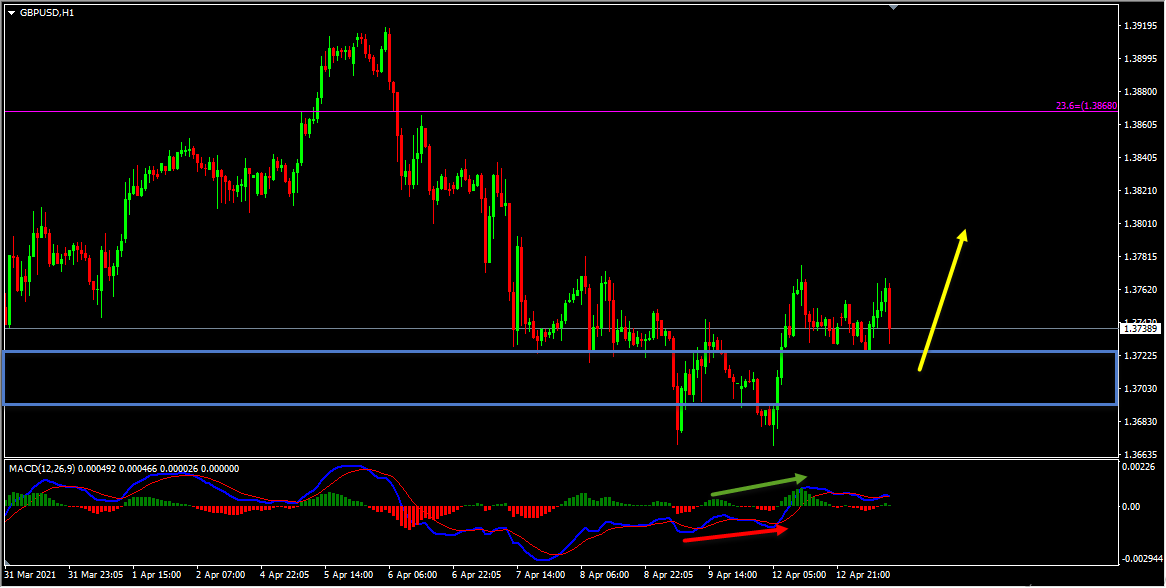
On the H1 chart we have a bullish divergence that has formed between the first low that has formed at 1.36694 and the second low that has formed at 1.36686 based on the MACD indicator. Then the price moved higher and broke above the high at 1.37438 creating higher highs, thus forming a classical setup of bullish divergence followed by bullish convergence. Hence as per the book scenario, after a bullish convergence, we may look for corrections to happen and then further continuation to the upside. Currently, it looks like the correction that we are looking for is happening. Until the strong support zone shown in the image below holds my view remains bullish here and I expect the price to move higher further.
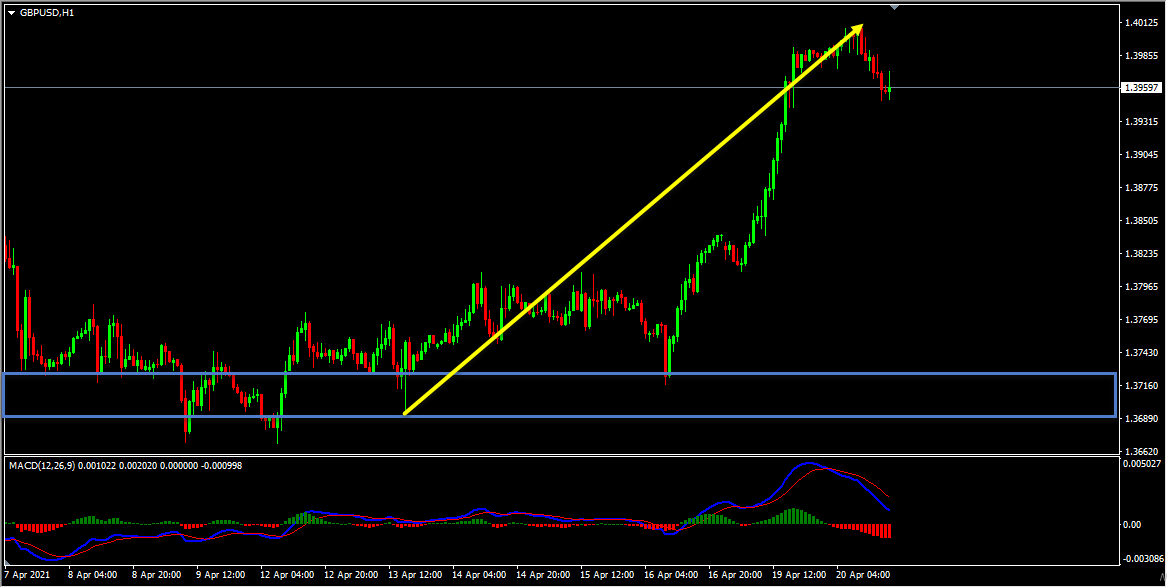
On the H1 chart, my view was bullish and I was expecting the price to move higher further until the strong support zone holds. After the bearish convergence, we had a pullback, and the price which was moving lower reached the strong support zone, respected it and bounced higher from this zone. All the facts were supporting the bullish view here, also there were no signs opposing this bullish view and most importantly the price was holding in the strong support zone. The price then moved higher further and delivered around 320 pips move so far.
As traders we always have two choices, the first one is to fall in love with our analysis and try to convince the market and expect the price to move in the direction as per our wish. The second one is to follow the facts that the market provides us and make the right actions according to that. As you know the first option won’t help us and as you can see in the example above what happened when we followed the facts that the market hinted us and took the right action according to that.
For similar trade ideas and much more join the Traders Academy Club and get access to our complete watch list and trade report.
This is how the report looks like. A table with the hottest market opportunities, screenshot behind every pair and time frame (anything that is in blue inside the table is clickable and leads to a screenshot) + a summary in text format, kind of highlights. And of course, Live Market Analysis every single day.
If you have any further questions, don’t hesitate to drop a comment below!
Happy Trading!
Yordan Kuzmanov
Chief Trader at the Traders Academy Club
Hi Traders! USDCHF short term forecast update and follow up is here. On May 20th,…
Hi Traders! CADCHF short term forecast and technical analysis is here. We do our analysis…
The dollar was broadly steady on Monday as cautious investors watched out for signals on…
Hi Traders! Arvinth here from the Home Trader Club team. The weekly summary and, review of July…
European markets edged lower on Thursday following more overnight volatility in Asia’s tech-dominated indexes, while…
Hi Traders! EURGBP short term forecast and technical analysis is here. We do our analysis…