Guest Post by Nicola Delic
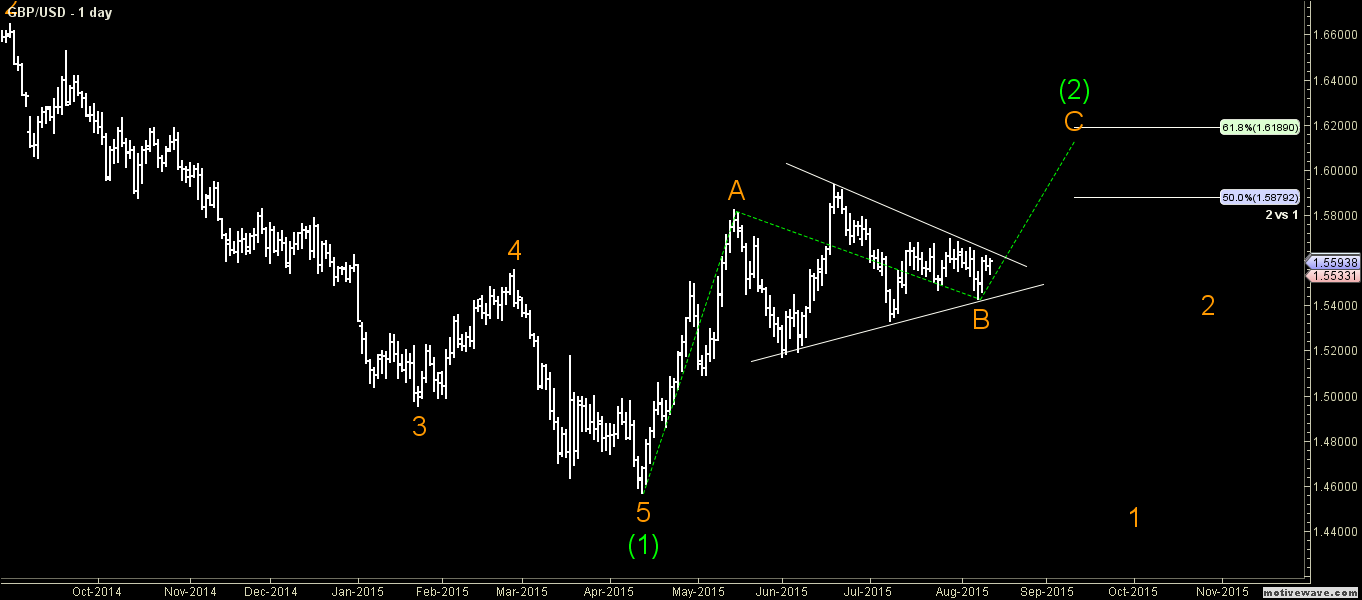
The British Pound after struggling against the US dollar finally managed to trade higher. IF we look at the daily chart of the GBPUSD pair, then we can notice a breakout pattern, as there is a triangle created. It looks like a bullish one, and if buyers manage to break the triangle resistance area, there is a chance of the pair trading higher in the medium term. So, I think we should be looking for buy opportunities.
In order to enter a buy trade I think we should wait for the GBPUSD pair to break and settle above the triangle resistance area.
Technical Analysis
D1– Chart representing the possibility of the GBPUSD pair trading higher and move towards 1.6000.
Entry:
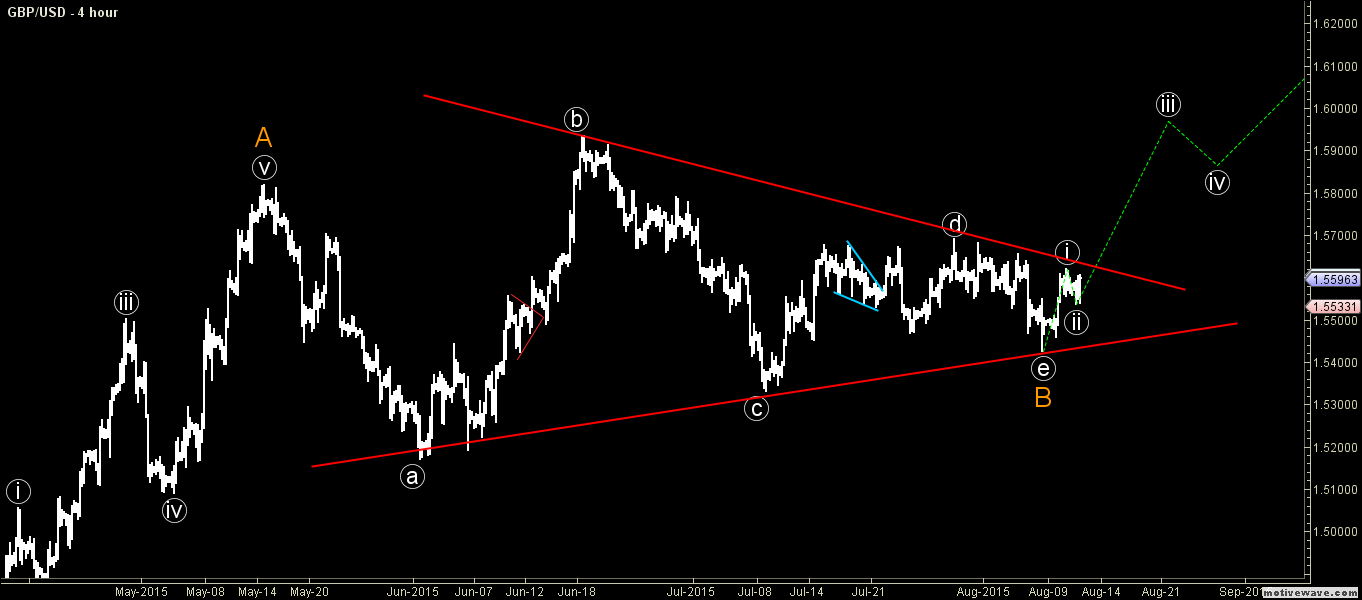
H4– We can enter a buy trade once the GBPUSD pair breaks and settles above the triangle resistance area.
Target 1: 1.5800
Target 2: 1.6000
Stop Loss: Below 1.5400
Video Explanation:
Hi Traders! Arvinth here from the Home Trader Club team. The weekly summary and, review of July…
U.S. stock indexes hit multi-week lows on Thursday, as concerns over heavy AI spending resurfaced…
Hi Traders! GBPUSD short term forecast and technical analysis is here. We do our analysis…
Hi Traders! Ethereum short term forecast follow-up and update is here. On May 26th, 2026…
Hi Traders! GBPAUD short term forecast and technical analysis is here. We do our analysis…
Hi Traders! USDCHF short term forecast update and follow up is here. On May 20th,…