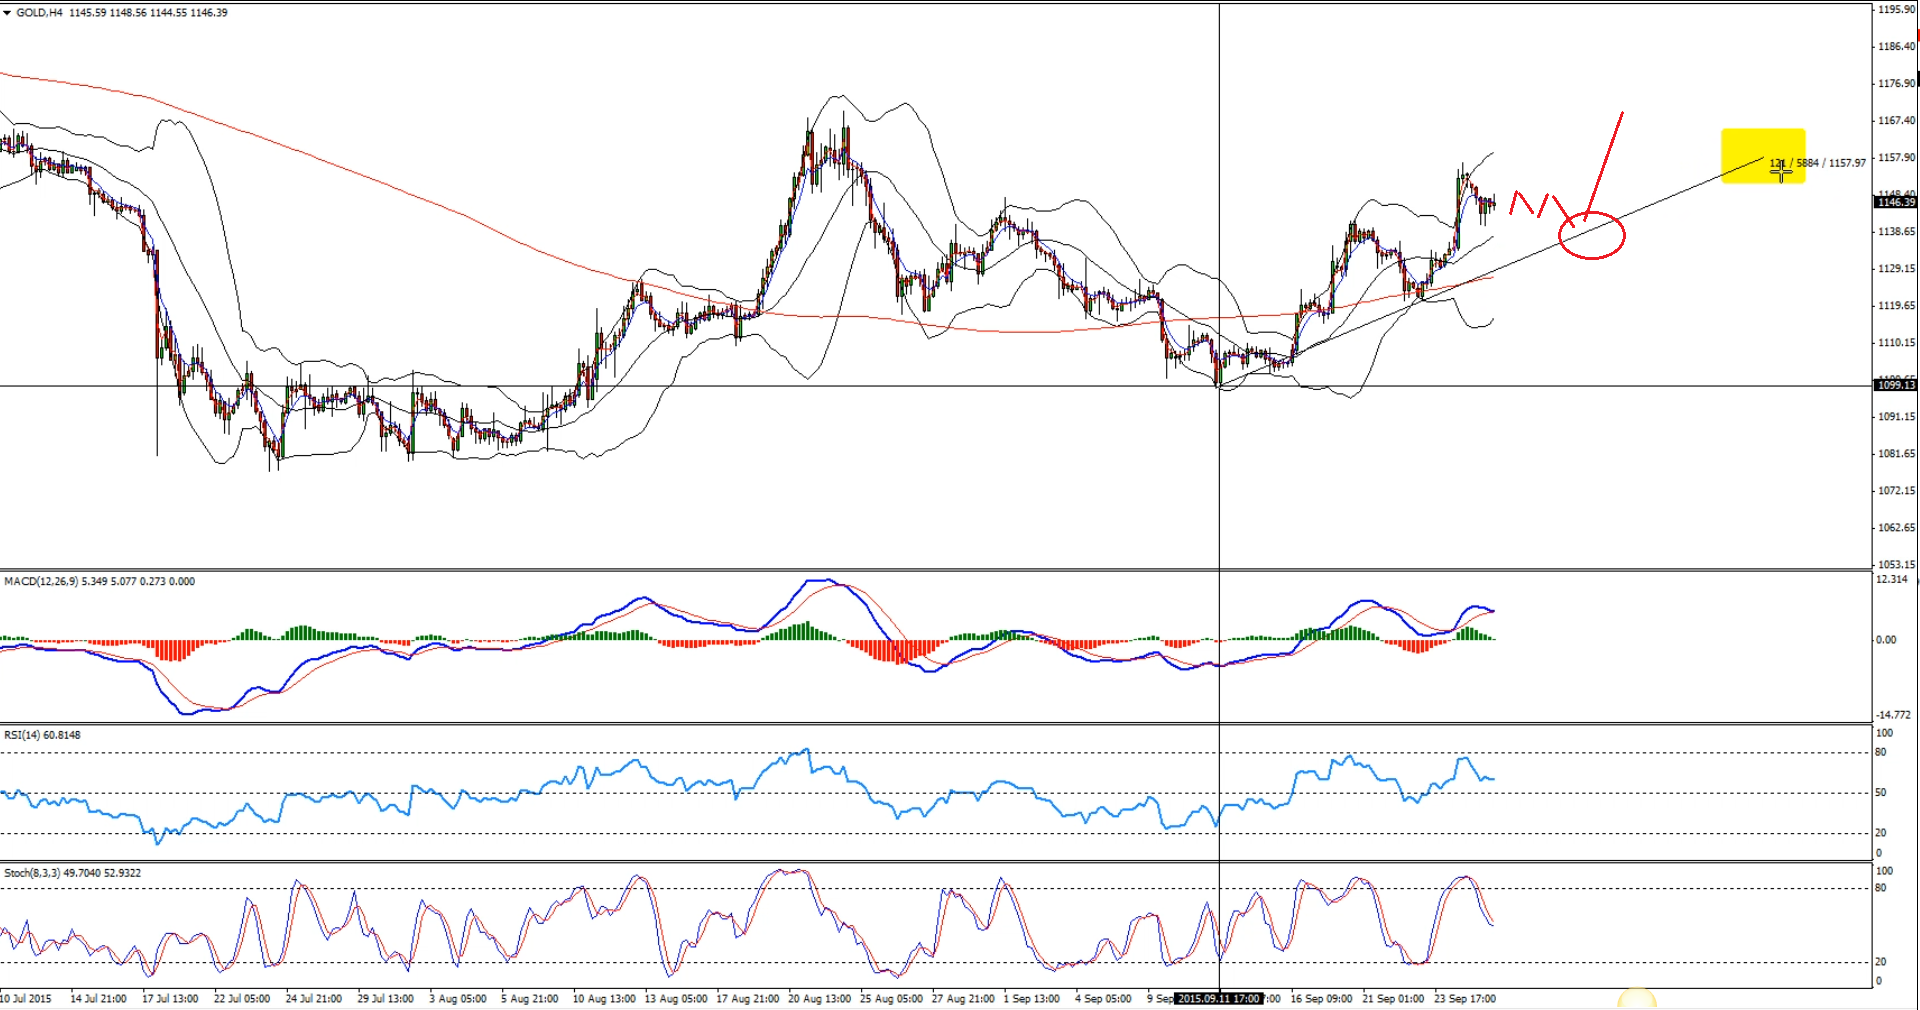
GOLD is enjoying a decent bullish run, and it might continue to trade higher in the short term. Our idea for now is to remain bullish as long as a bullish trend line on the 4-hours chart holds. However, once the price reaches a very important resistance area of $1165-70 there is a chance of it facing sellers.
There is a wave duplication pattern developing on the 4-hours chart, which might complete around $1166-70 level. In that scenario, we might consider entering a sell trade.
Technical Analysis
Buy Entry
H4– We can enter a buy trade in GOLD if it corrects lower in two waves and trades near the trend line and support area (as shown in the chart).
Target 1: $1160
Target 2: $1165
Stop Loss: Break and close below the trend line.
Sell Entry:
H4– We can enter a sell trade in GOLD once it completes the wave duplication pattern and trades near $1166-70.
Target 1: $1150
Target 2: $1135
Stop Loss: Break and close above the last high created before entering into the trade.
Video Explanation:
Yours,
Vladimir
Hi Traders! Arvinth here from the Home Trader Club team. The weekly summary and, review of July…
U.S. stock indexes hit multi-week lows on Thursday, as concerns over heavy AI spending resurfaced…
Hi Traders! GBPUSD short term forecast and technical analysis is here. We do our analysis…
Hi Traders! Ethereum short term forecast follow-up and update is here. On May 26th, 2026…
Hi Traders! GBPAUD short term forecast and technical analysis is here. We do our analysis…
Hi Traders! USDCHF short term forecast update and follow up is here. On May 20th,…