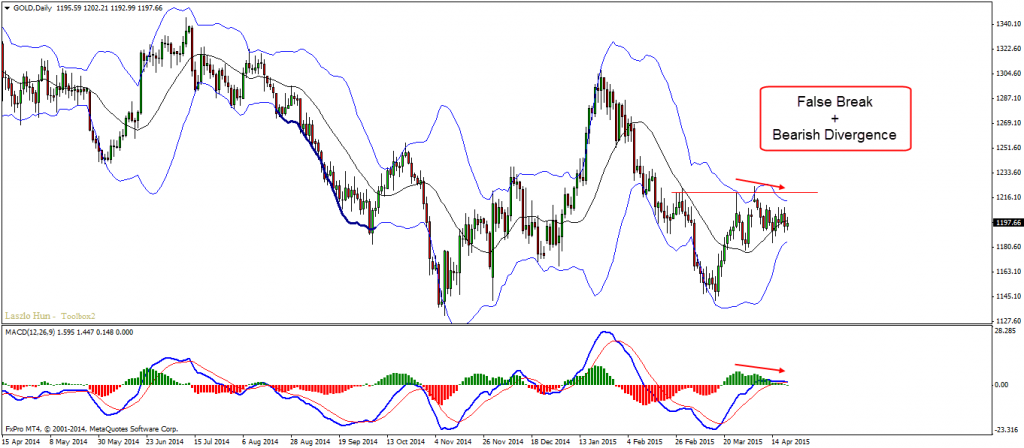
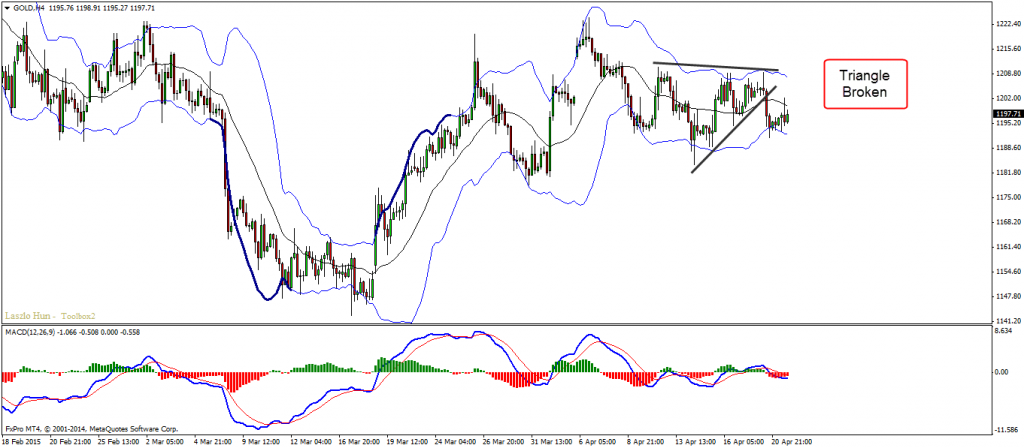
Technically gold has all the reasons to continue lower. Daily chart is under bearish pressure because of the divergence. It made a false break up and we have a nice flag, showing correction well seen on the H1 chart. The plan is to join if and once the up trend line is broken.
Technical Overview:
D1 – bearish divergence, false break
H1 – flag/trend line
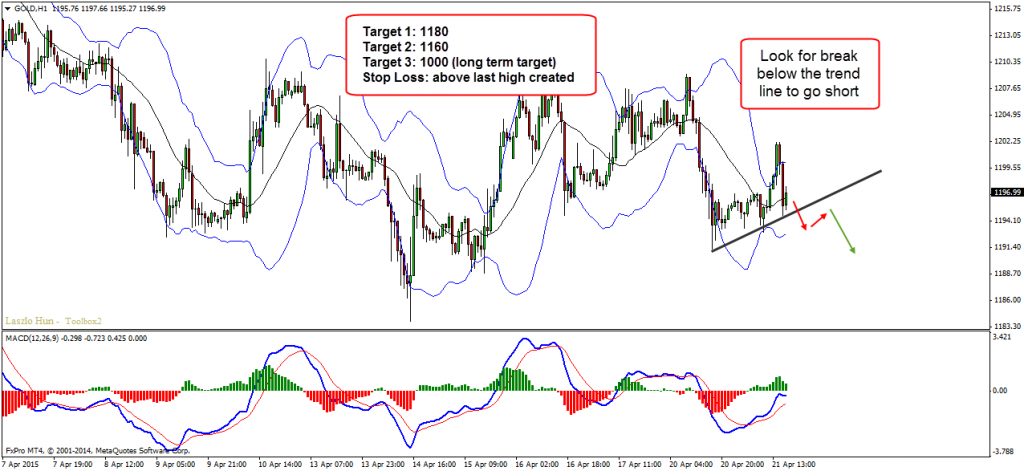
Entry: H1 – Look for a break below the trend line along with the most recent support and go short.
Target 1: 1180
Target 2: 1160
Target 3: 1000 (long term target)
Stop Loss: above last high created
Yours,
Vlad
Hi Traders! Arvinth here from the Home Trader Club team. The weekly summary and, review of July…
U.S. stock indexes hit multi-week lows on Thursday, as concerns over heavy AI spending resurfaced…
Hi Traders! GBPUSD short term forecast and technical analysis is here. We do our analysis…
Hi Traders! Ethereum short term forecast follow-up and update is here. On May 26th, 2026…
Hi Traders! GBPAUD short term forecast and technical analysis is here. We do our analysis…
Hi Traders! USDCHF short term forecast update and follow up is here. On May 20th,…