Hi Traders! In this article we will talk about “The Matryoshka Trading Principle”. If you are looking for a killer intraday strategy with fantastic risk-reward ratio and optimized entry levels then look no more. The Matryoshka Principle is the result of years in front of the charts combined with some of the oldest tricks in the book. It is simple, elegant, optimized and very easy to follow Forex trading strategy. Best part – it is completely free!
The Matryoshka idea and principle is entirely based on the divergences. So before we can jump into it we need to understand what is a divergence and how to spot it.
Definition : Imbalance between the price action and the oscillator indicator.
There are multiple types of divergences which we are not going to cover today as we need to understand and learn about one specific divergence – the regular divergence.
Why Divergences are so important?
In other words, we can use them on their own or in combination with other techniques to spot very accurately entry and target zones.
Divergences are spotted using an Oscillator Indicator such as RSI, MACD, stochastic, CCI and so on.
I personally rely and use MACD (not the traditional one, we have another one which we are using in our Traders Academy Club) and also I rely on the RSI (If you want to learn about the RSI indicator you can find the complete guide here) which I believe is pretty accurate.
If you want to learn about MACD, you can find the complete trading guide here
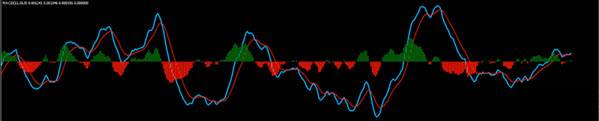
MACD consists of two elements:
1. Moving averages (Red and Blue lines)
2. Histogram (red and blue bars)
Divergences subcategories
Generally we can break down the divergence into two sub-categories:
In the Matryoshka principle we are going to use the type of divergence that forecasts potential reversals and/or strong pullbacks (aka regular divergence).
Regular divergence
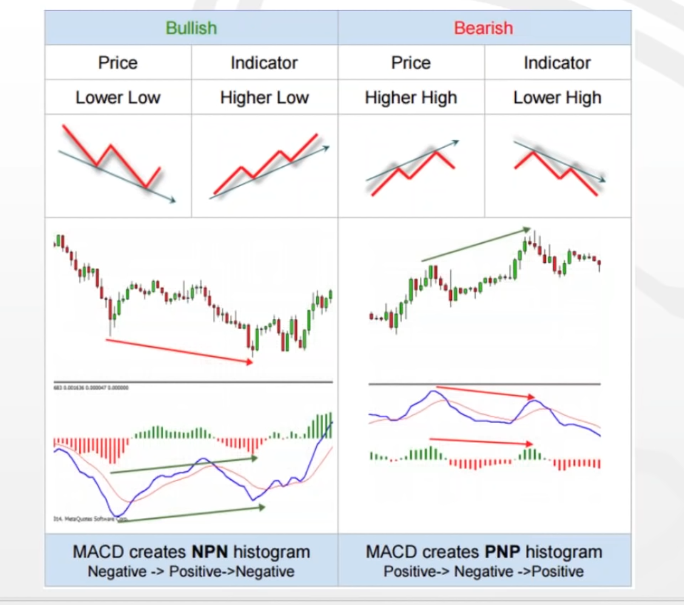
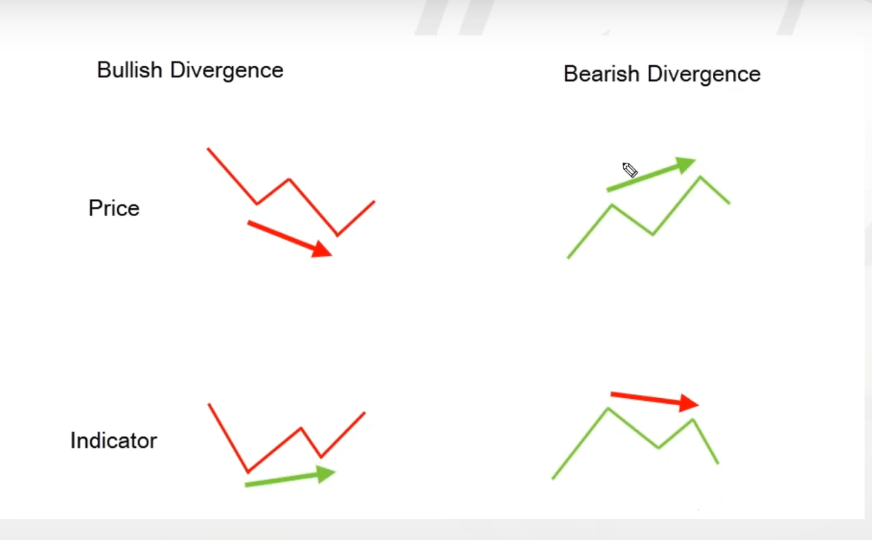
Divergence appears on the chart when the Price action is going in One direction, while the oscillator indicator is going in another direction.
To make things simple :
Divergence breakdown:
If price and Indicator are not following each other, the market is talking to you. It is telling you to prepare for potential reversals or pullbacks.
The main participants in this UP or DOWN move had enough and they are cashing out now.
In theory every divergence would give us an ideal zone where the price is going to reverse.
In reality however, this is not always the case. That’s why we need a confirmation that will give us an edge when we are dealing with divergences.
That being said let’s break the divergence into stages:
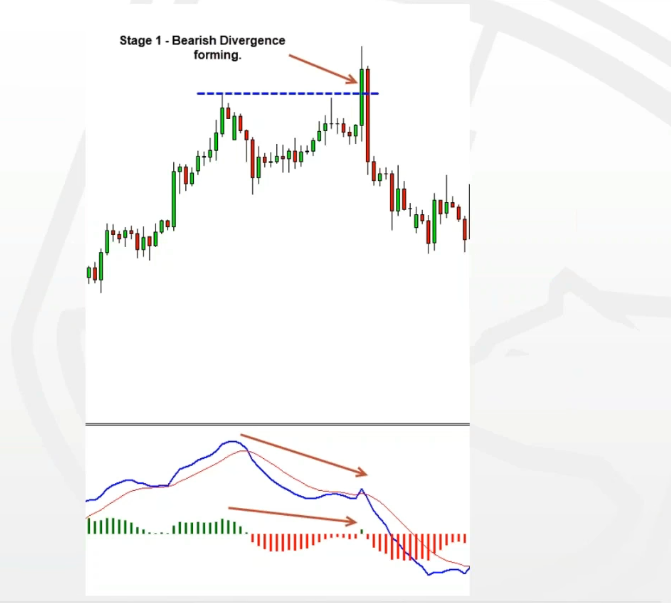
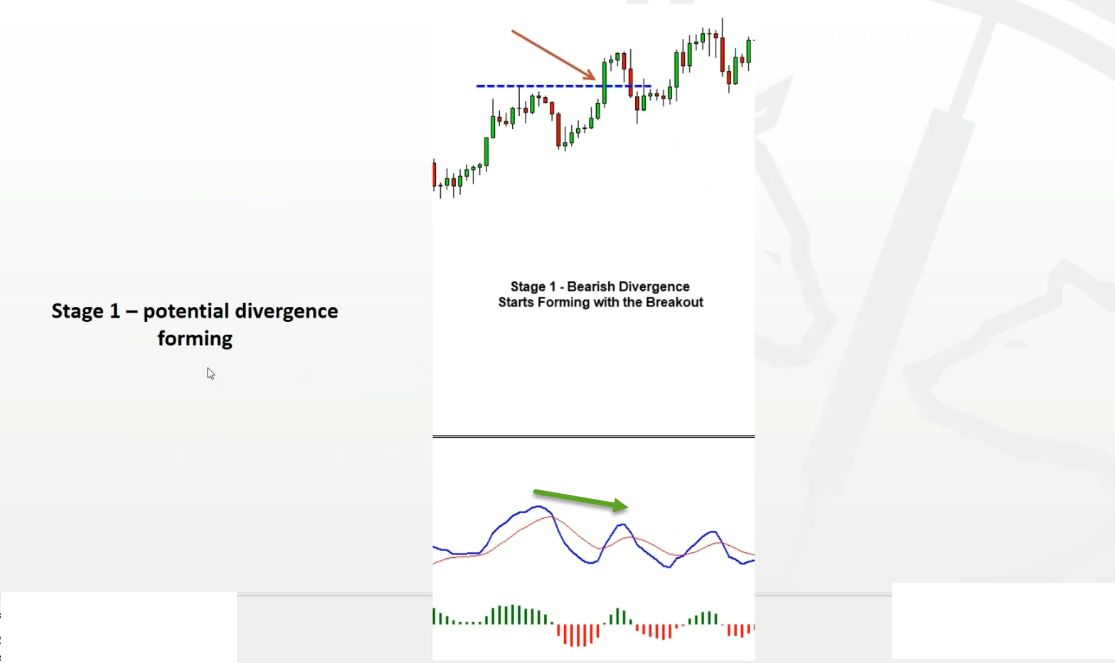
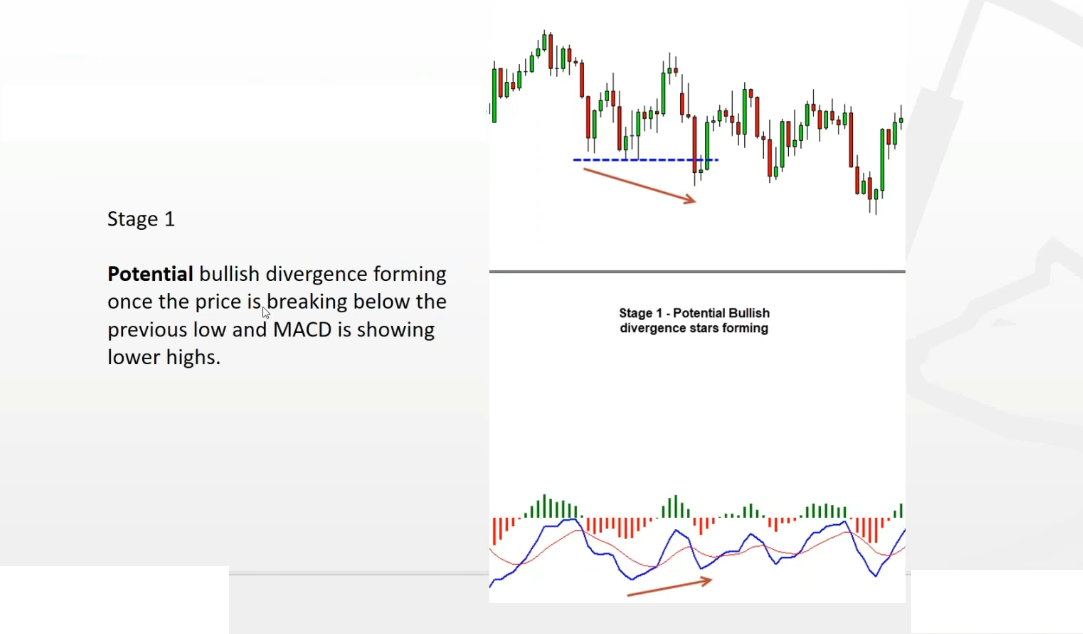
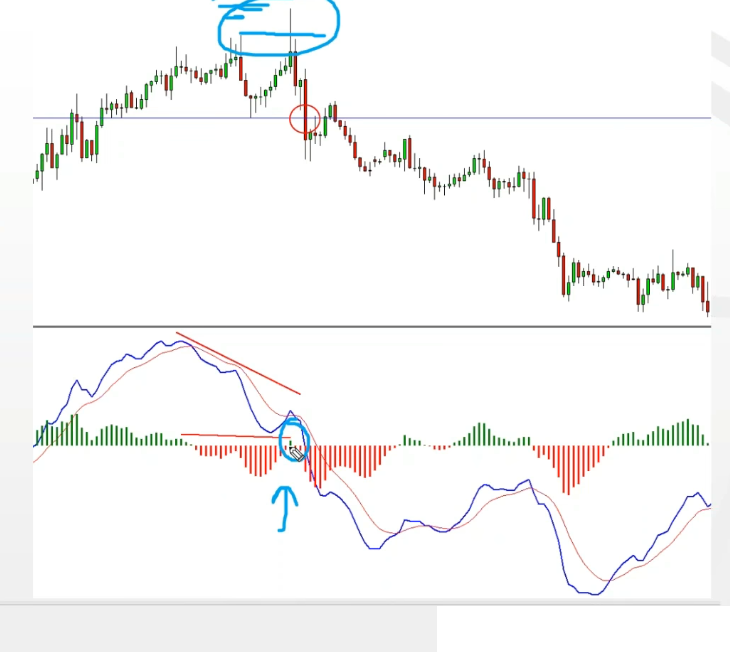
Stage 1 – Forming potential divergence
Potential bearish divergence forming once the price is breaking above the previous high and MACD is showing lower highs.
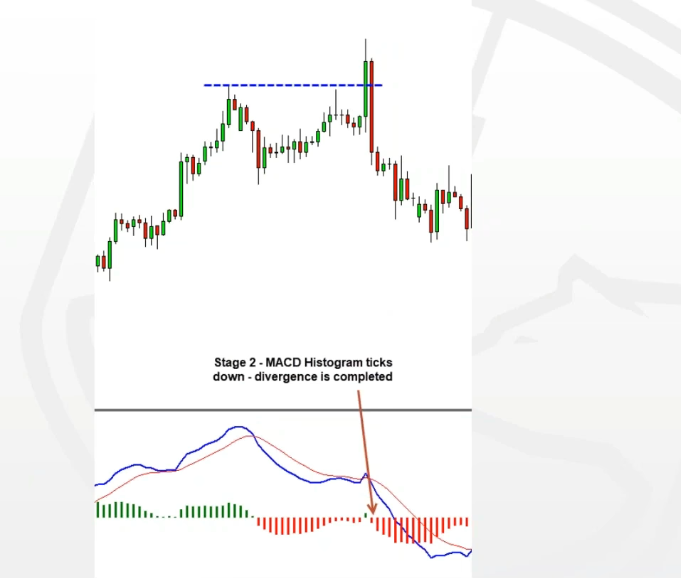
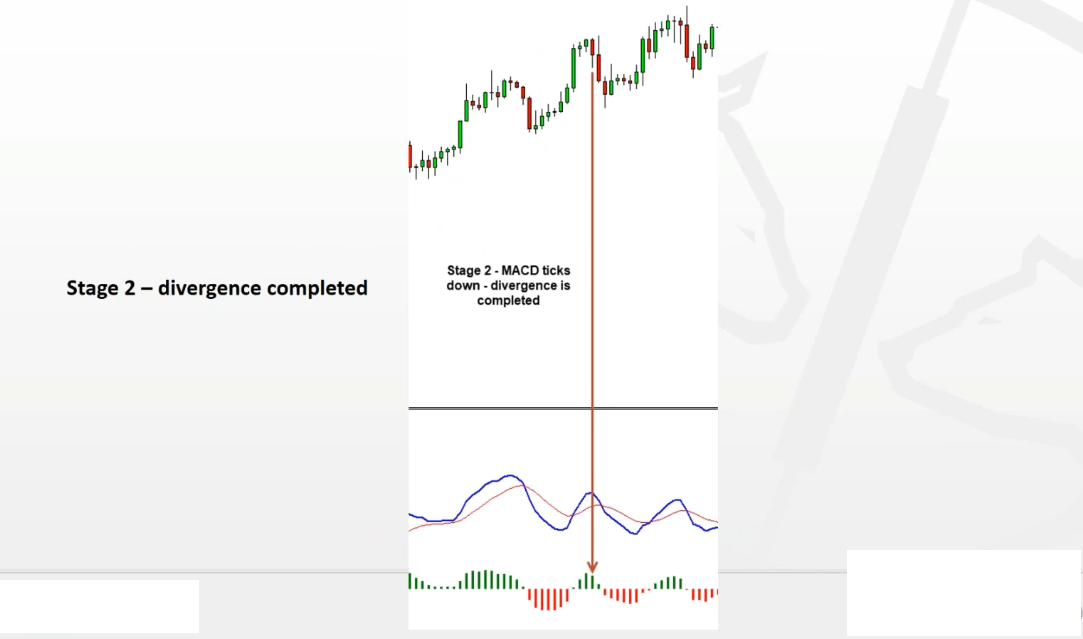
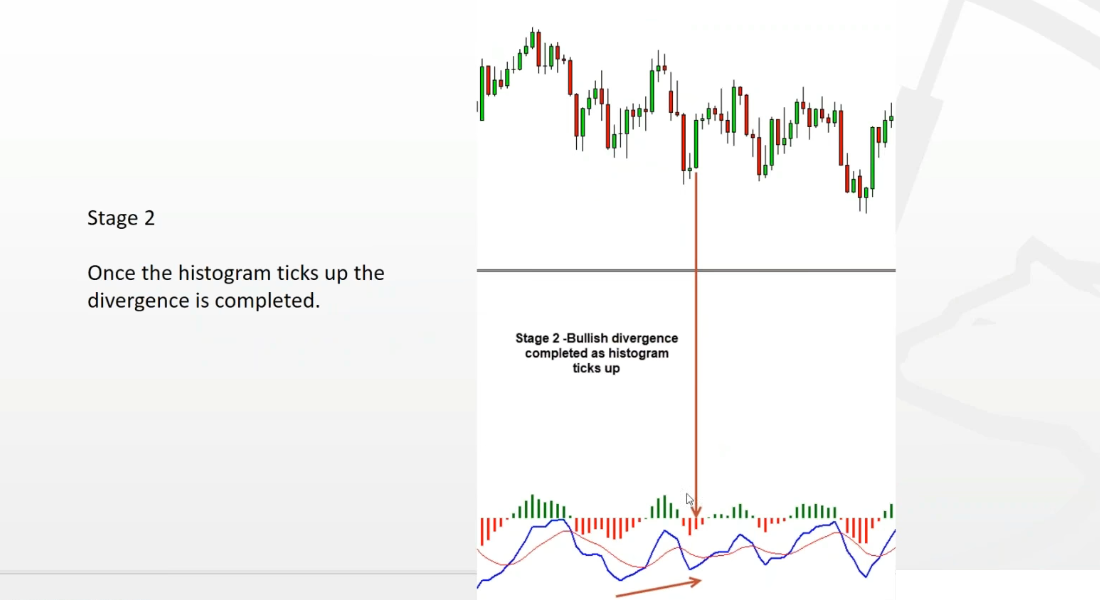
Stage 2 – Completed divergence
Once the histogram tick down (as this is bearish divergence), the divergence is now completed.
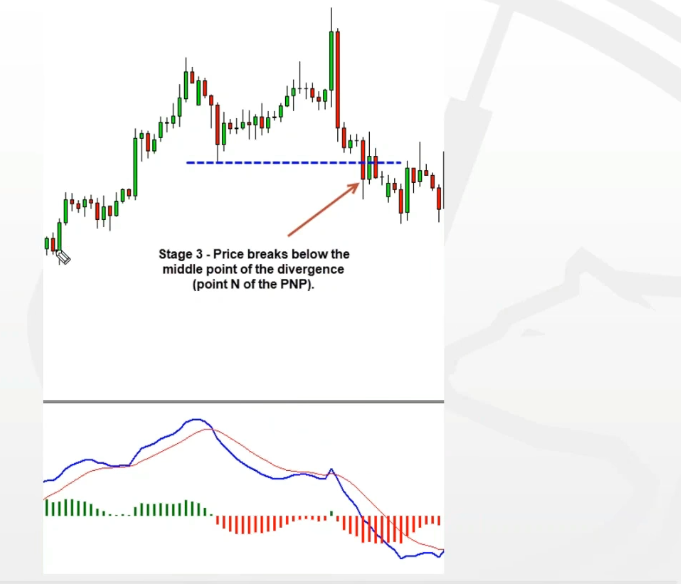
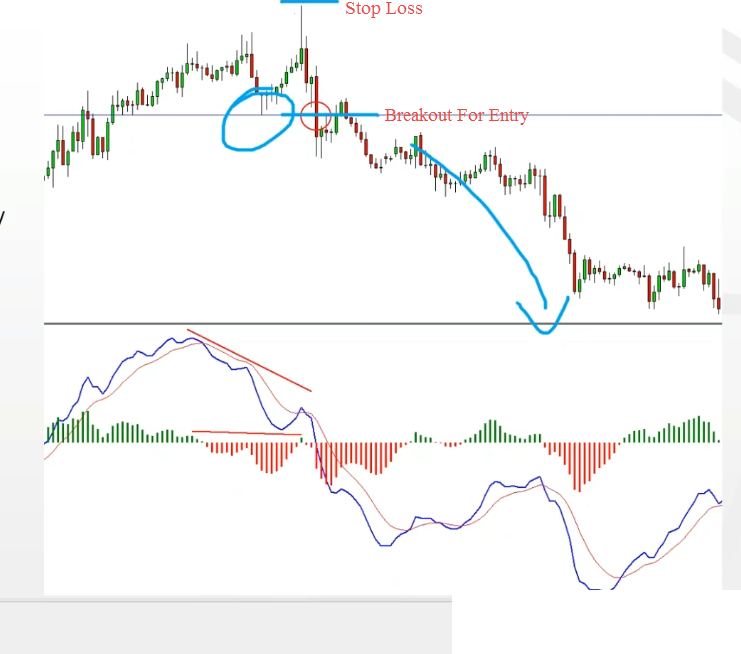
Stage 3 – Break out of middle point – The entry
In this example, the price is making the breakout after stage 2. This is the place where we will be entering a trade. That’s the entry trigger. In this example that would be a sell.
Now let’s see an example where we got in validation instead of breakout. This is pretty much how a divergence develop and complete. Either with a Breakout (entry) or invalidation.
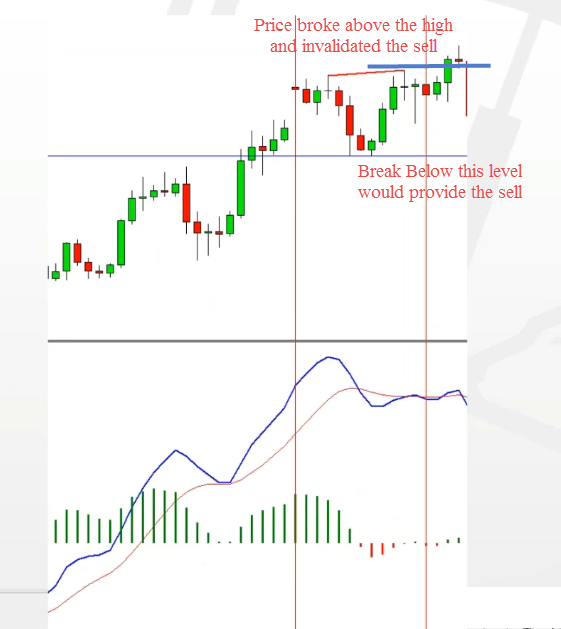
Stage 1
Potential bearish divergence forming once the price is breaking above the previous high and MACD is showing lower highs.
Stage 2
Once the histogram ticks down, the divergence is completed.
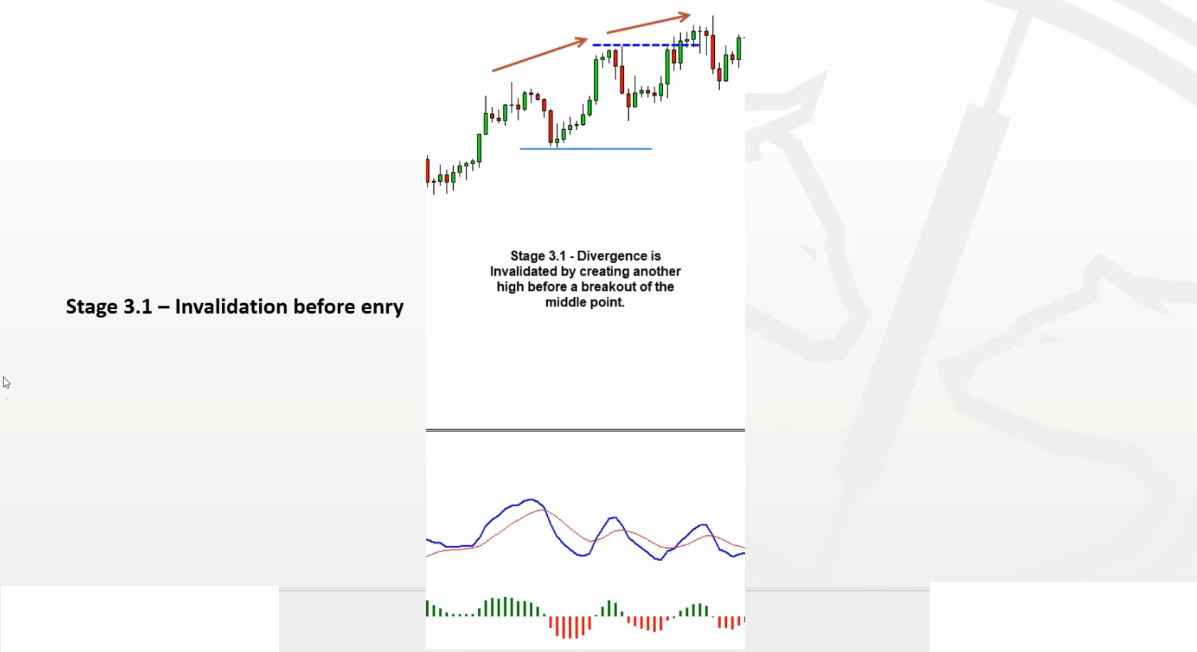
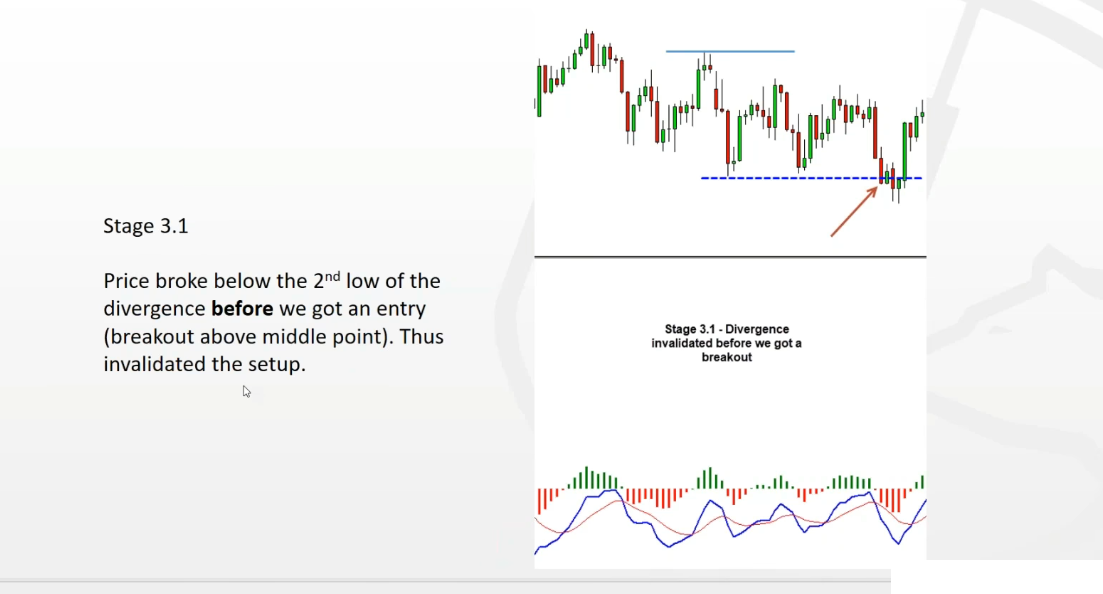
Stage 3.1
Price broke above the 2nd high of the divergence before we got an entry (breakout below the middle point). Thus invalidated the setup.
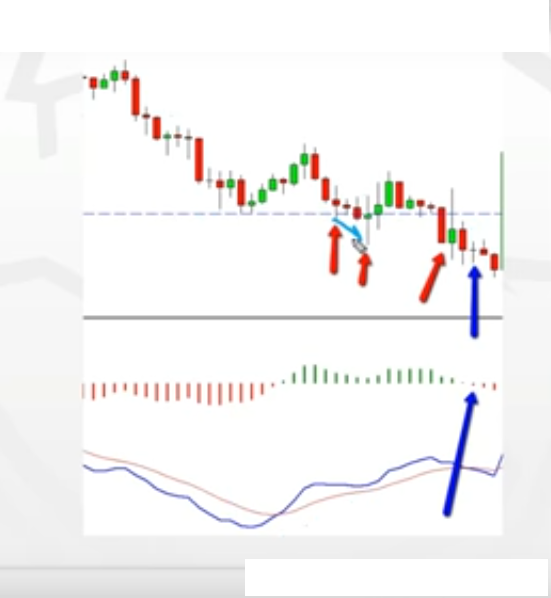
Let’s quickly cover the bullish scenario:
Example 1:
Stage 1:
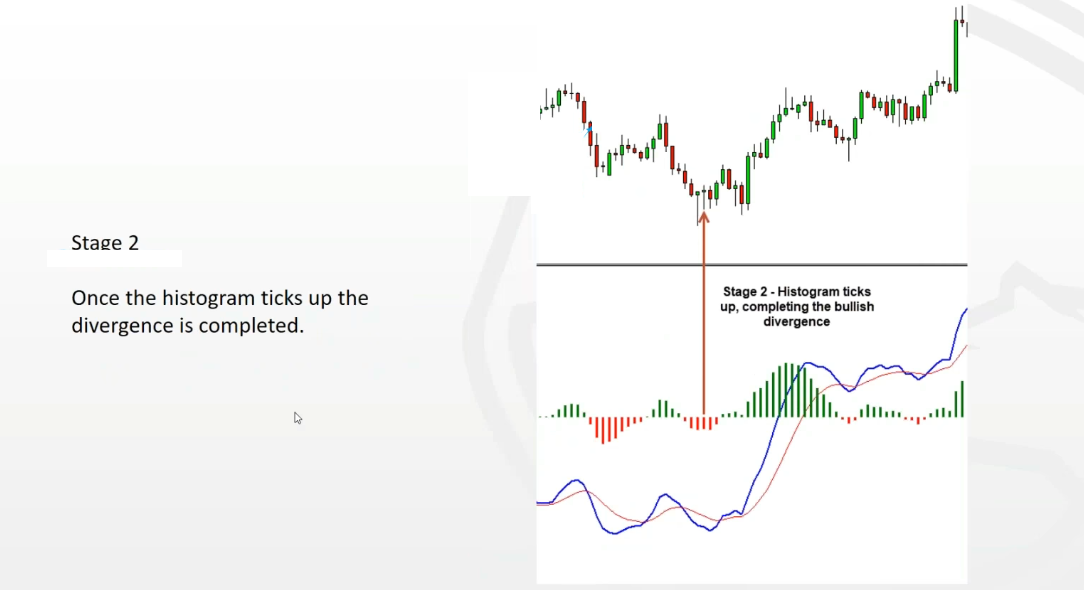
Stage 2:
Stage 3.1:
Example 2:
Stage 1:
Stage 2:
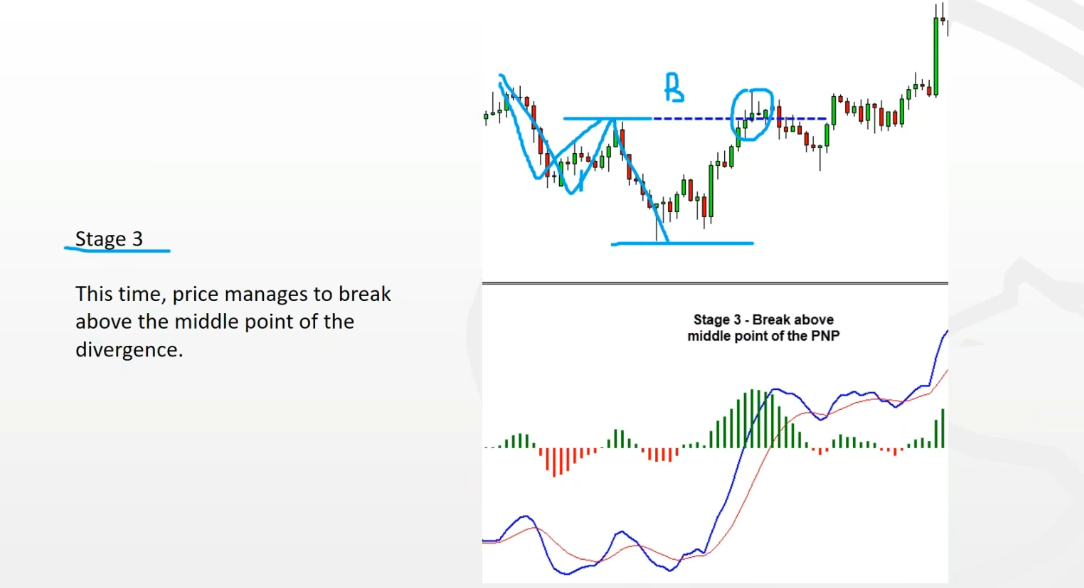
Stage 3:
Note: If you want to learn more in-depth insights about divergences, you can benefit greatly from the videos on my channel here while also embarking upon Divergence University for comprehensive divergence education.
Idea:
Matryoshka principle as the name suggests, aims to lock the price into continuously shrinking ranges, that provide us with outstanding risk reward ratio.
Definition:
We are following multiple timeframes that form divergences during the same market cycle and jump into a trade only once there is a confirmation for a breakout from the most recent divergence.
Multiple entries are not mandatory but highly recommended.
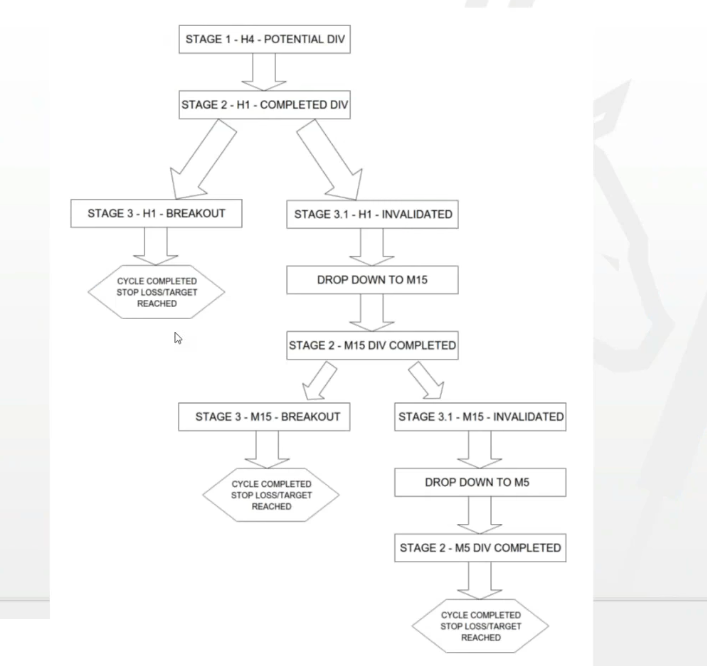
How does it work in reality:
1. Spot potential divergence on a given time frame (the highest time frame of your setup).
2. Drop to the next lower timeframe and wait for divergence to form and complete. At that stage there are two scenarios:
– Scenario 1: Breakout (entry)
– Scenario 2: Invalidation (We drop 1 more time frame lower and look for the next divergence to form that we can attack)
3. Scenario 1: In case of a break out (the middle point of the divergence) we are executing a trade.
4. Scenario 2: In case of invalidation of the divergence on the current time frame, we are dropping one more time frame lower, and look for completed divergence and break out there.
Bullish example
H4 chart – On the H4 chart we have a potential bullish divergence starts forming. This is where we want to drop to the lower time frame and look for completed bullish divergence.
H1 chart – Perfect, price formed a bullish divergence on MAs and Histogram, it also completed it by ticking up on the histogram.
All we need now is a break above the middle point of the divergence (the blue line) in order to get into a buy. However, just a few candles later we got a spike below the low, invalidating the H1 setup.
What is our next move?
Drop down to the next lower timeframe and look for completed divergence on it!
Guess what we find once we drop lower?
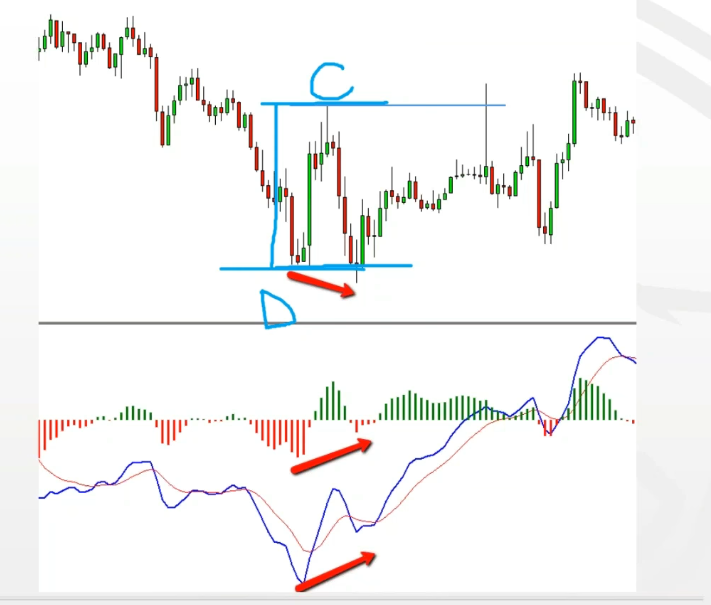
The spike actually completed a divergence on the M15 chart. That means our risk reward ratio got even better as we have locked the price in even smaller range (between C and D)! as shown in the image below.
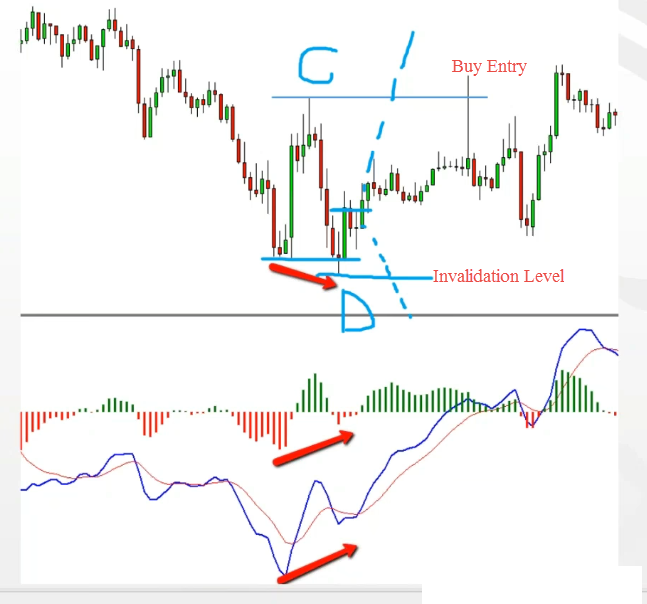
So now we just need to see a break above the “C” for buys which is the new middle point of the newest divergence or break below the “D” for invalidation. Here in this case we got a buy entry.
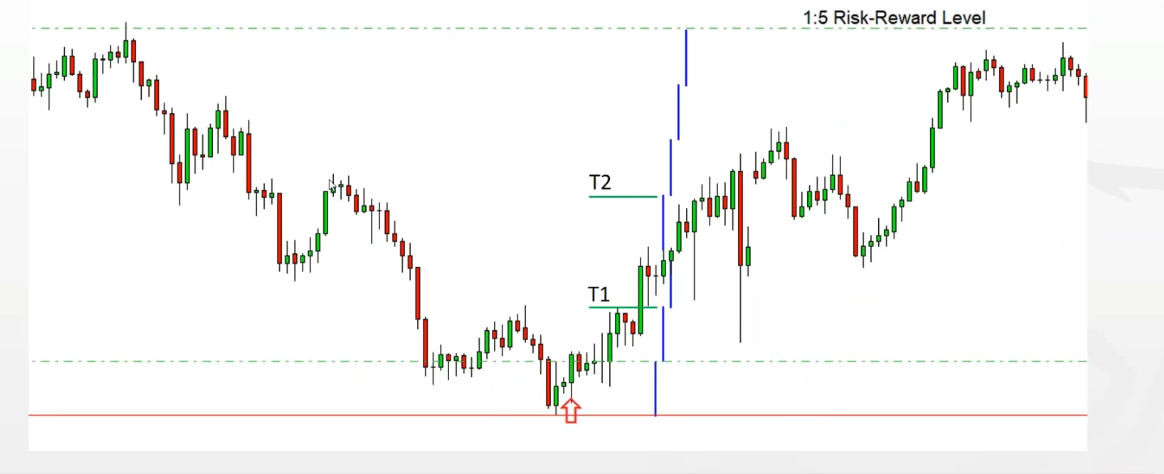
Now if we go back to the H4 chat we can see in perspective where the Matryoshka signal would appear and what a move we have ahead of us. 1:5 risk reward ratio was provided at the end, which is more than enough for the 1:3 risk reward ratio that we are looking for.
Bearish Example:
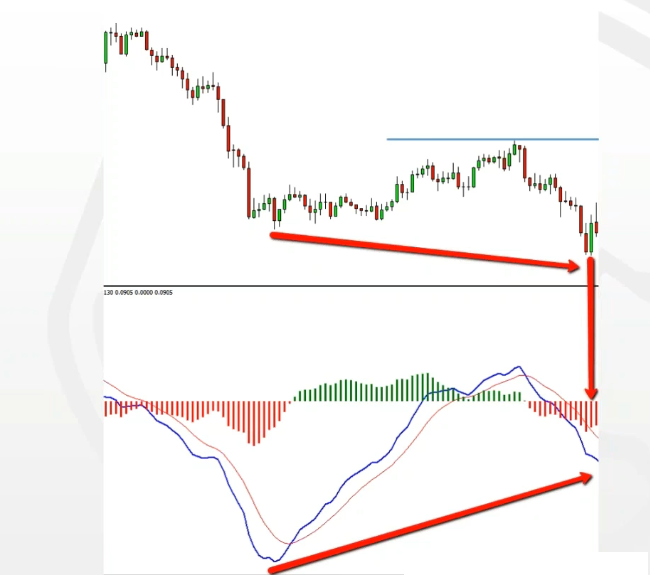
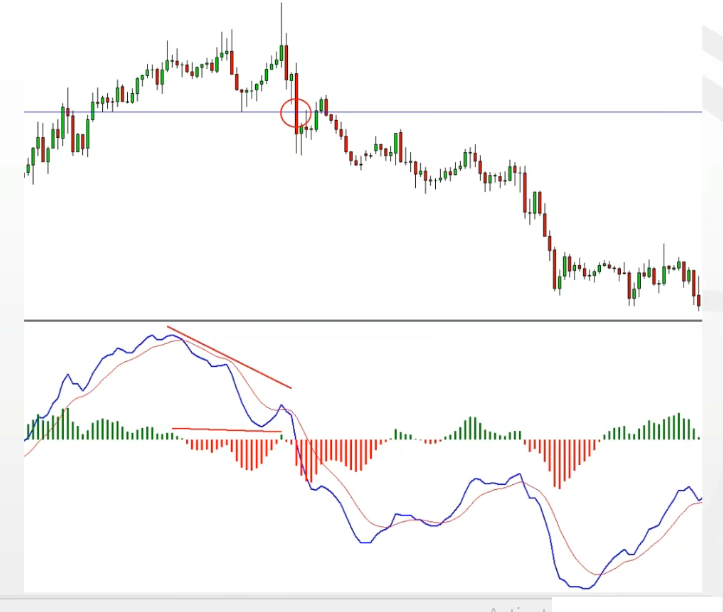
Potential bearish divergence spotted on D1 chart. As the divergence is still developing and forming, we drop down to the H4 chart.
On the H4 chart we are now looking for potential sell setups. What we need to see before selling is the following:
We got the first requirement completed but before we got a sell trigger (break below the blue line) the price broke above the high, thus invalidating this time frame for a potential entry.
This is when we drop down to the next time frame available and look for the same setup.
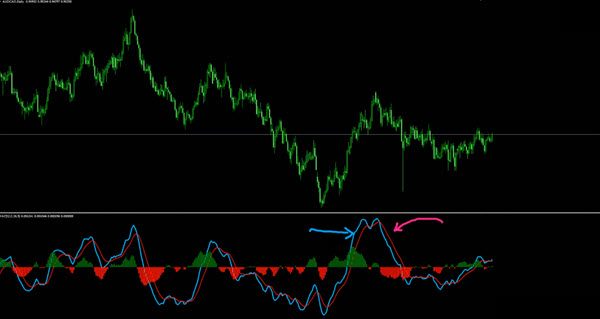
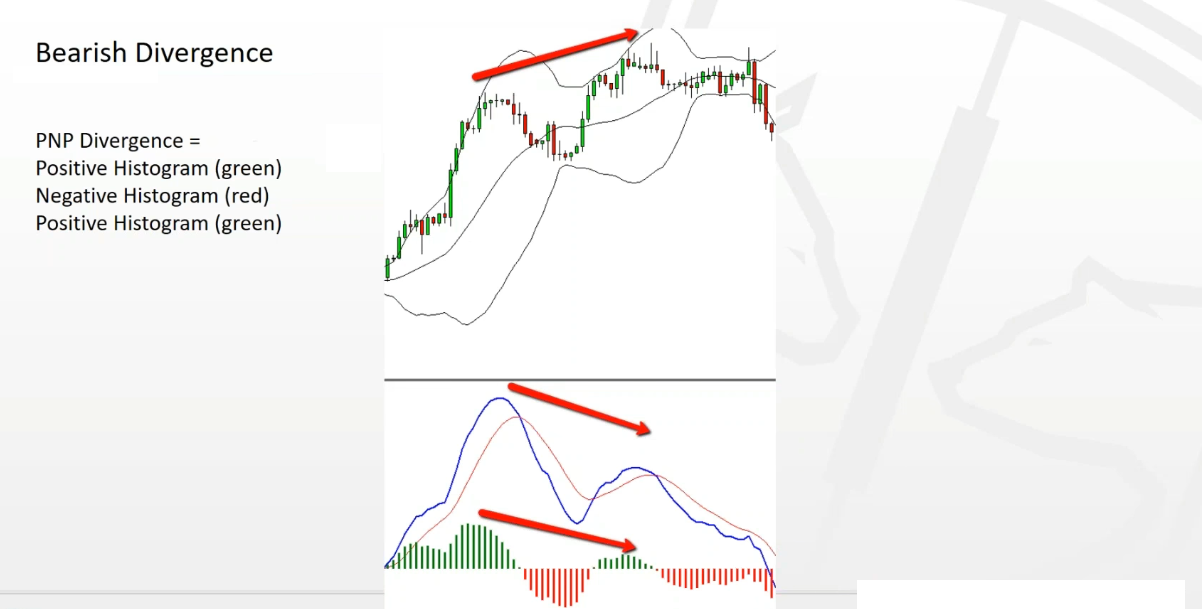
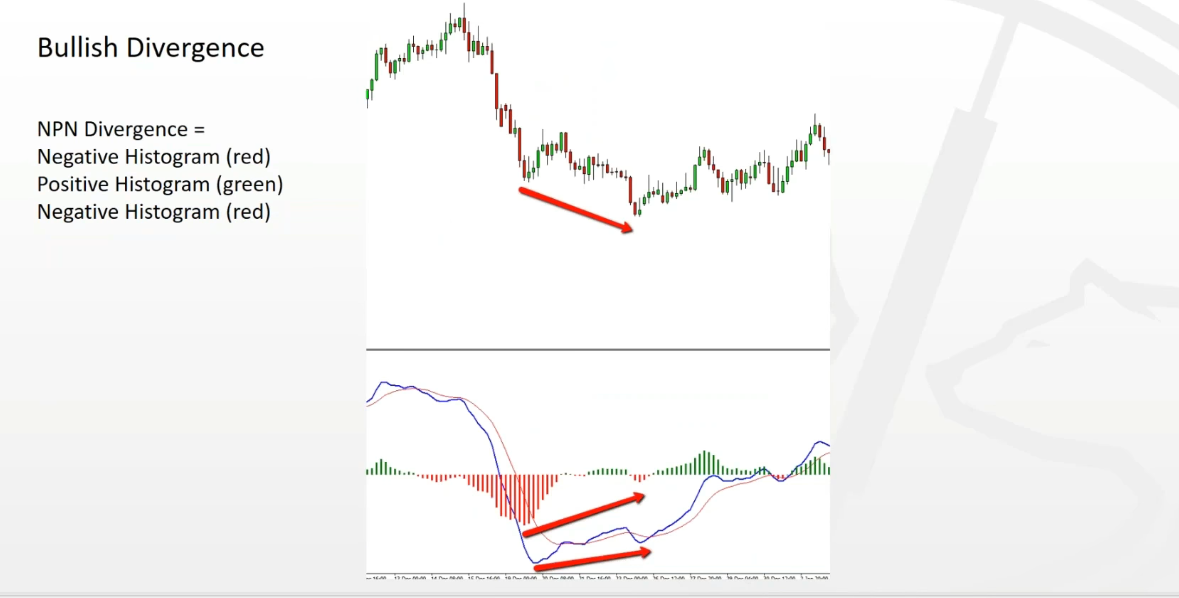
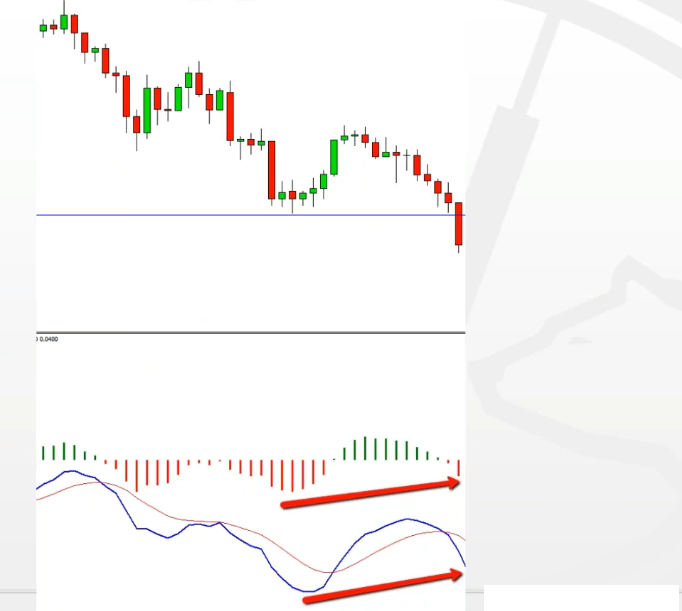
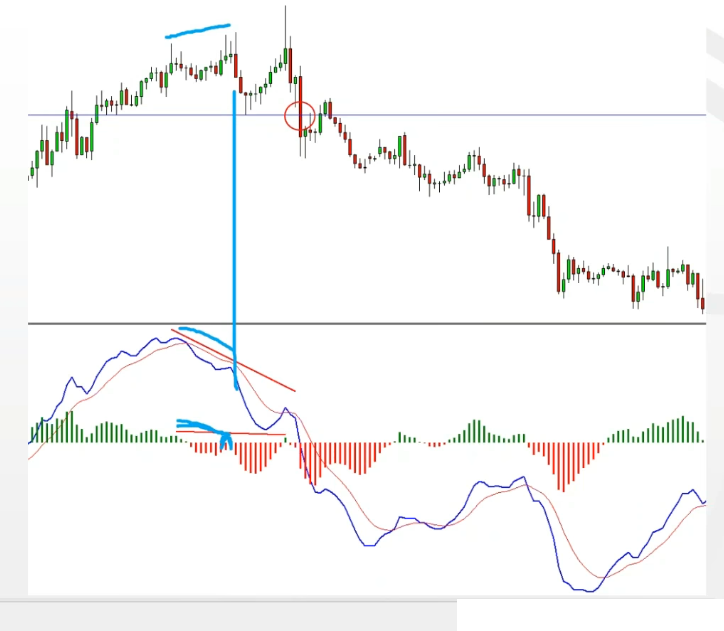
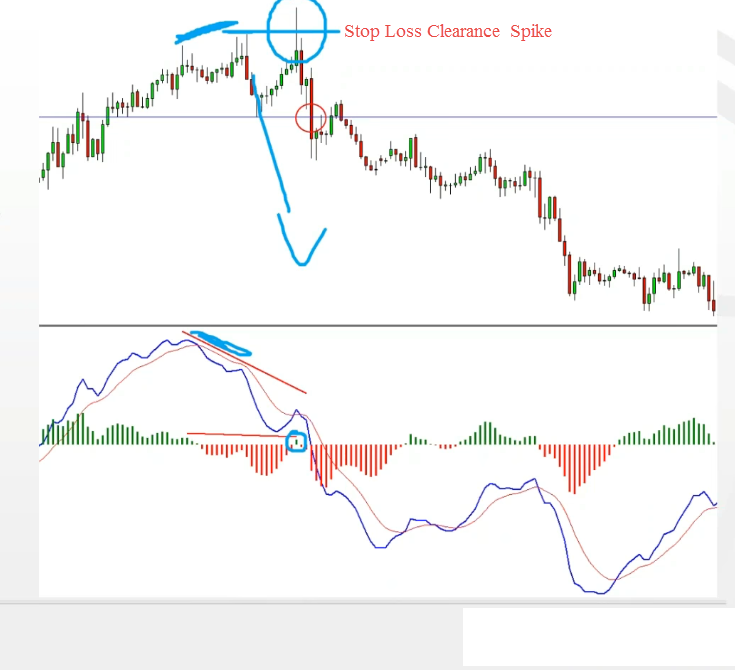
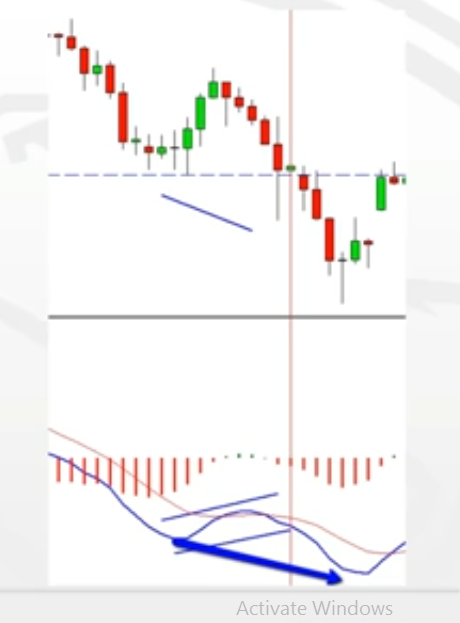
(Note: I picked this example on purpose because this one is tricky, if you notice we have divergence in the area shown in the screenshot but what we don’t have is PNP
This is why I care so much about the PNP (Positive, Negative, Positive) on the histogram because one leg divergences could be tricky when you are trading a regular style (meaning when you have stop losses in place). The one leg divergence is basically the divergence which comes from the Moving Averages without the histogram like what we have in this case. This is a good example because some times this might work but at many times it would simply spike (stop loss clearance spike) as shown in the image below.
This clearance usually comes with momentum which will be shown on the histogram, this is why I like to see PNP or NPN).
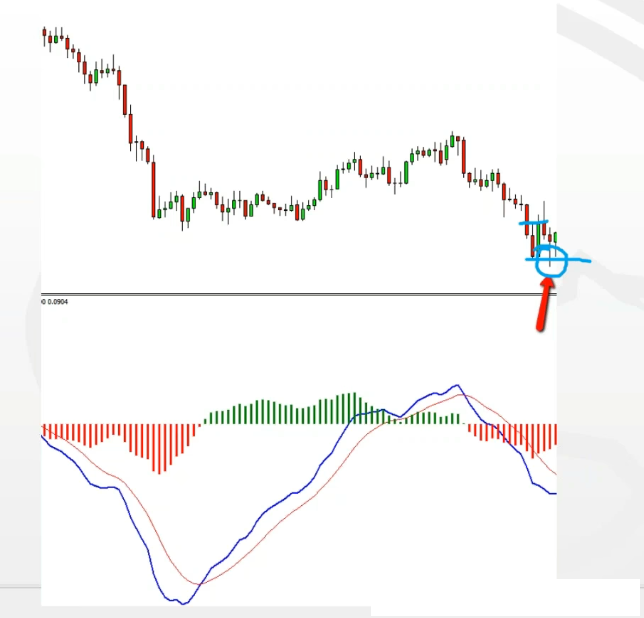
Back to the example, after some price fluctuations, we finally got an entry 2 timeframes lower (we started with D1).
Price broke below the middle point of the PNP divergence and we can sell.
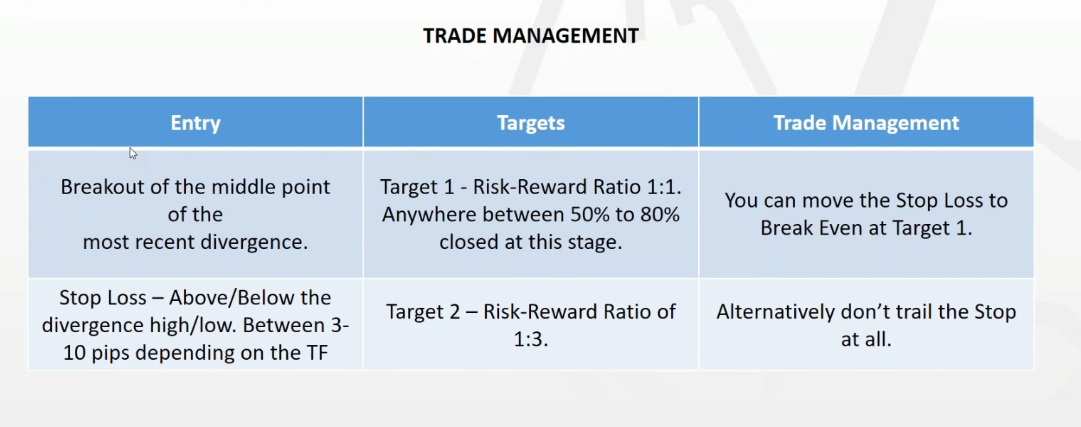
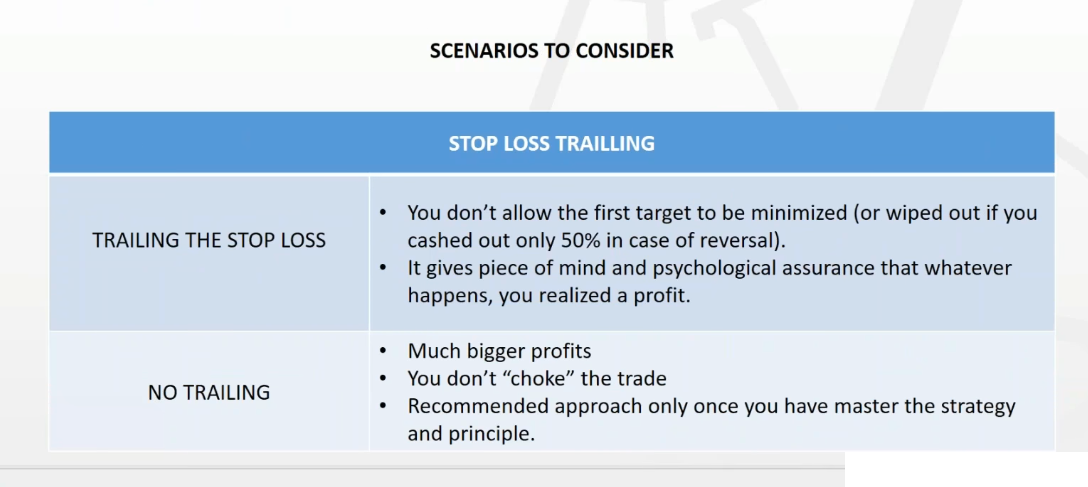
Protection is placed above the last high and first target is collected when you have 1:1 risk reward ratio in your favor (The target is entirely up to you to decide how do you want to go ahead and manage it).
FINAL NOTES AND TIPS
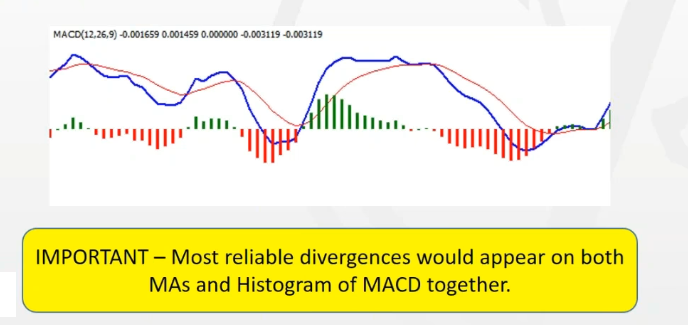
1. The Breakout in stage 1 must be coming on MAs and Histogram (PNP/NPN).
2. At the time of the entry on the lower time frames, it is best to still have pressure in terms of divergence from the higher time frame(Stage 1).
It could be divergence on both MAs + Histogram or MAs only or Histogram alone. Anything is better than no divergence at all. Adjust your trading risk accordingly.
This is not a mandatory requirement but when it fits, get ready for even better returns.
Example-
You started with H4 (stage 1 potential bullish divergence).
By the time you got entry on M15, H4 only had bullish divergence on histogram (MAs got invalidated). That would make the trade slightly more aggressive.
3. When to stop looking for a setup?
If you switched down to a lower time frame, and the price made the move you were looking for but it DID NOT create a setup on your current time frame, game over. Once you see the previous time frame(1 time frame higher than the current one) entry level broken, move on.
Example:
Stage 1 – H4 potential bullish divergence -> drop to H1.
Stage 2 – H1 -> completed div and invalidated -> drop to M15 – M15 -> no divergence and move happens. Price breaks above the H1 entry-level.
Then you don’t trade the H1 chart setup. Look for the next opportunity.
4. Trade management and targets
– Don’t sell yourself short. Don’t be lazy. Do your homework and see what works best for you. See what fits best to your trading style and personality. Whatever works best for me might not be the one for you. You have the idea of the principle and the entry rules. Trade management and targets could be adjusted according to your needs and understanding of the market.
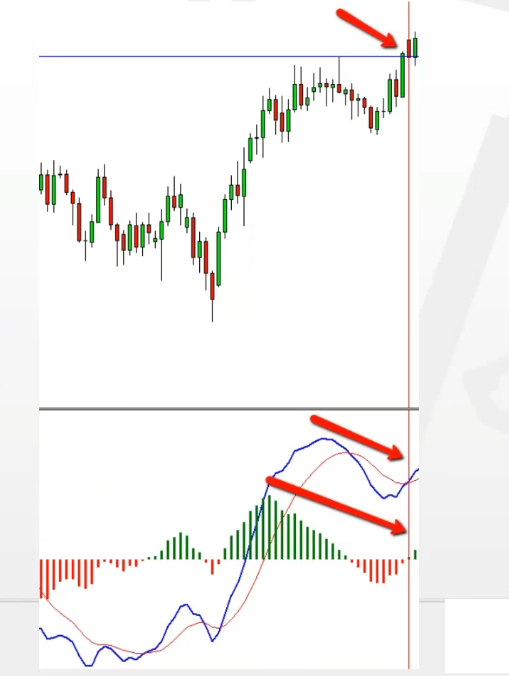
Idea (This method requires managing of the trade):
Don’t use hard targets based on Risk – Reward ratio. Wait for divergence on the trading time frame to form, complete and break the middle point (basically a reversal setup). That is your first and last target. Go back, test it. See where your performance curve will be sent.
So traders, this is what I wanted to share with you all about one of the important Forex strategy that we use in our trading “The Matryoshka Trading Principle”.
Watch the webinar of The Matryoshka Trading Principle
I invite you to join me in my live trading rooms, on daily basis, and improve your trading with us.
Also you can get one of my strategies free of charge. You will find all the details here
Thank you for your time reading this article.
To your success,
Vladimir Ribakov
.
Hi Traders! Arvinth here from the Home Trader Club team. The weekly summary and, review of July…
U.S. stock indexes hit multi-week lows on Thursday, as concerns over heavy AI spending resurfaced…
Hi Traders! GBPUSD short term forecast and technical analysis is here. We do our analysis…
Hi Traders! Ethereum short term forecast follow-up and update is here. On May 26th, 2026…
Hi Traders! GBPAUD short term forecast and technical analysis is here. We do our analysis…
Hi Traders! USDCHF short term forecast update and follow up is here. On May 20th,…
View Comments
Too useful and worth reading
Thank you Vlad and team. Have a great weekend.
You are very welcome