Hi Traders! NZDUSD short term forecast update and EURNZD technical analysis is here. On April 21st 2020 I shared this “NZDUSD Short Term Forecast” in my blog. In this currency pair the price moved perfectly as per my analysis. If you would like to learn more about the way we trade and the technical analysis we use then check out the Traders Academy Club. Spoiler alert – free memberships are available! In this post lets do a recap of this setup and see how it has developed now.
Missed this trade?
Never miss a trade opportunity again! Join the Traders Academy Club
Now lets summarize the idea first:
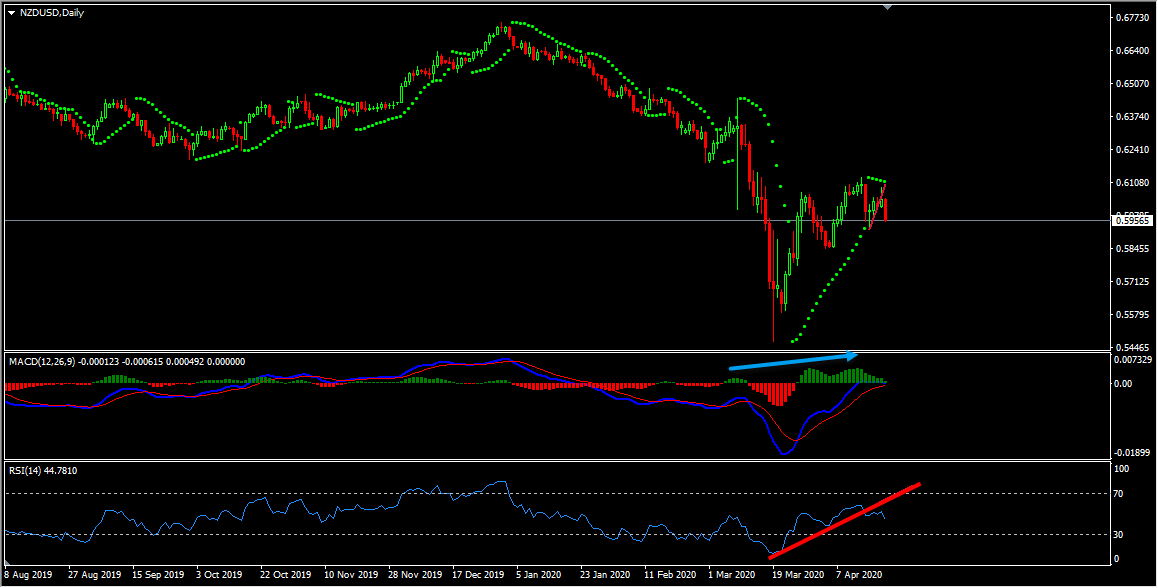
Bearish Hidden Divergence, Parabolic Sar, RSI Indicator uptrend line breakout.
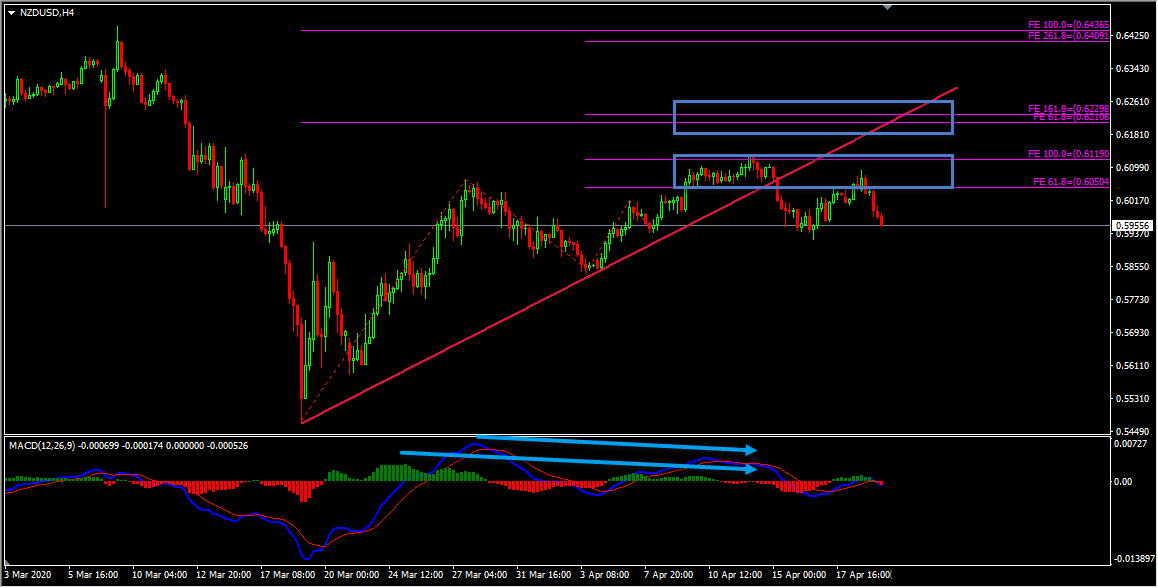
Important Resistance Zone, Bearish Divergence, Uptrend Line Breakout
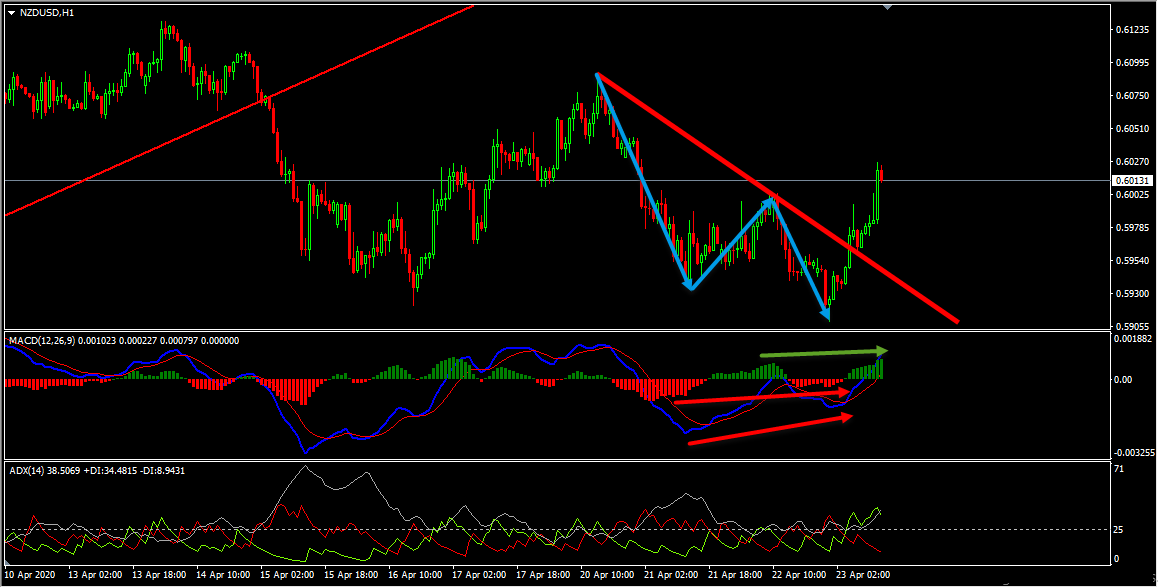
On the H1 chart we had a good uptrend line that has formed and the price had broken below this dynamic support, which we considered as an evidence of bearish pressure. In addition to this the ADX indicator gave bearish signal at the cross of -DI (red line) versus +DI (green line) and the main signal line (silver line) reads value over 25 which we considered as another evidence of bearish pressure. Also the price had created a classical setup, we had a bearish divergence and then the price moved lower and created lower lows thus forming a bearish convergence for us, we considered this as yet another evidence of bearish pressure. So based on this my short term view remained bearish here and I expected further continuation lower.
On the H1 chart the price moved exactly as per my analysis, the pullback that we were looking for happened and then the price moved lower exactly as I expected in the short term and delivered around 90+ pips move. Then we had opposite evidences in the form of false breakout with bullish divergence, uptrend line breakout and higher highs.
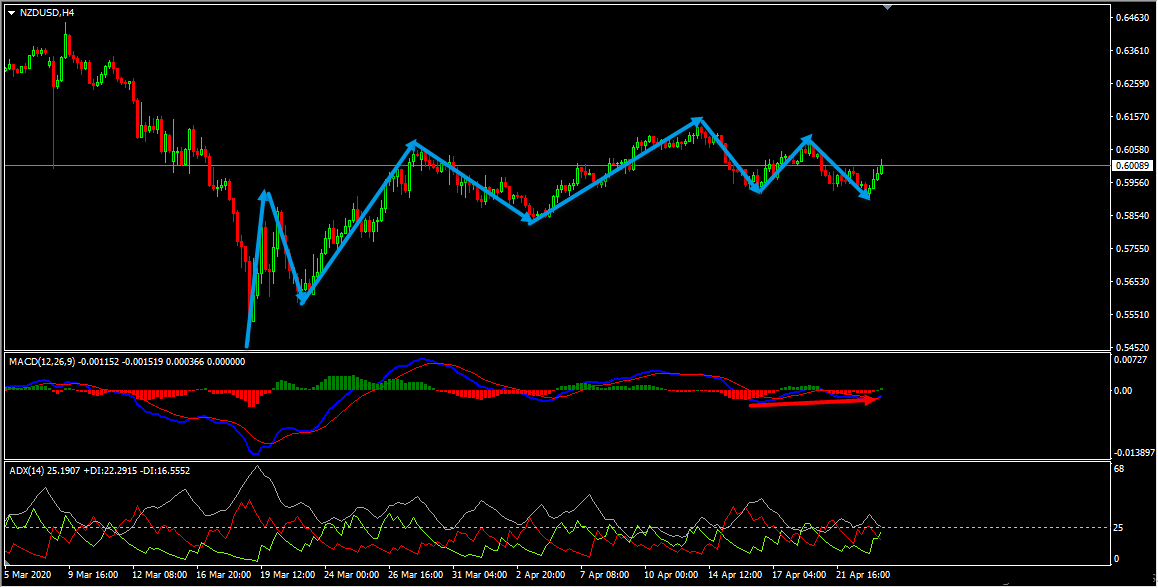
On the H4 chart we had a bullish trend pattern followed by a correction in the form of double wave down, currently we have a bullish divergence which we may consider as an opposite evidence. So the bottom line here is that we have opposite evidences on both the H1 and H4 timeframes and NZD looks very strong now, so my view is not bearish here anymore.
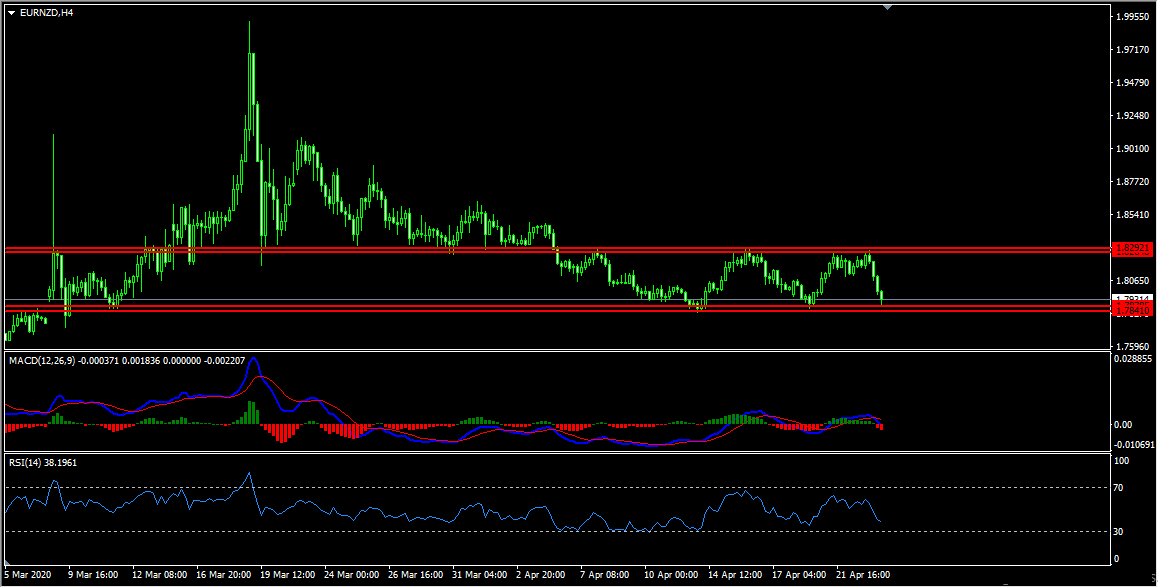
So based on the above mentioned evidences on NZDUSD, we could see that the NZD is very strong now, so we may expect it to reflect in the EURNZD pair. Currently on the H4 chart we could see that the price is moving inside a range, this range is formed by the price reaching parallel resistance and support zone and it is respecting them so far.
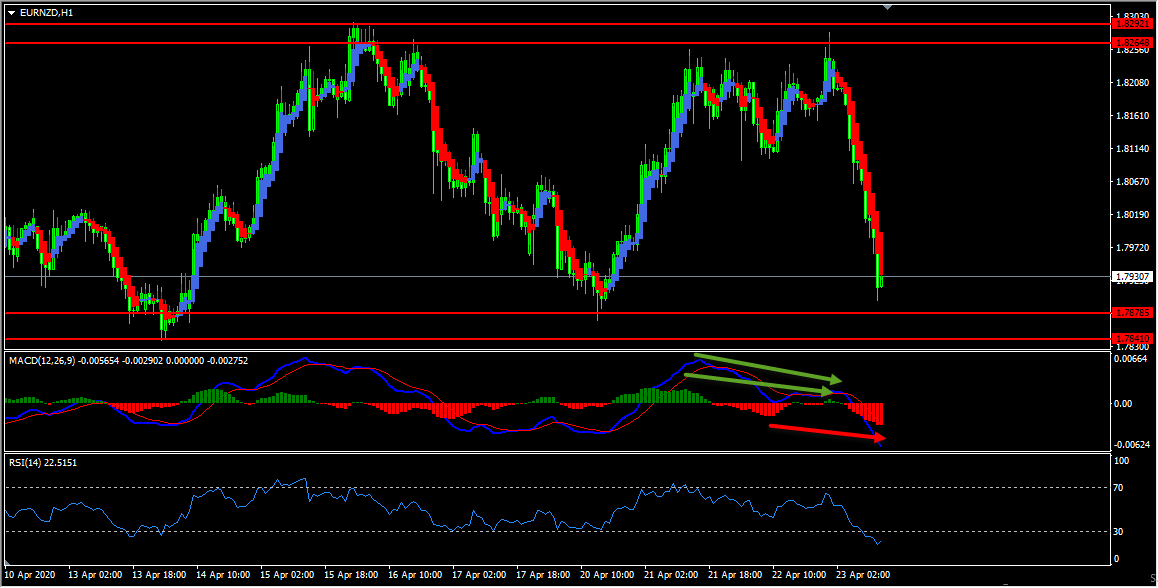
On the H1 chart we could see that the price reached an important resistance zone, we had a false break with bearish divergence on both histogram and moving averages of the MACD indicator. Then the price moved lower and broke below the last low and created a bearish convergence which we may consider as evidences of bearish pressure. In addition to this based on the Heikin Ashi candles we can see that currently we have strong bearish bodies in downward moving market conditions so it basically reflects a bearish environment, so until the condition changes my short term view remains bearish here.
For similar trade ideas and much more join the Traders Academy Club and get access to our complete watch list and trade report.
This is how the report looks like. A table with the hottest market opportunities, screenshot behind every pair and time frame (anything that is in blue inside the table is clickable and leads to a screenshot) + a summary in text format, kind of highlights. And of course Live Trading Room every single day.
If you have any further questions, don’t hesitate to drop a comment below!
To your success,
Vladimir Ribakov
Certified Financial Technician
Hi Traders! Arvinth here from the Home Trader Club team. The weekly summary and, review of July…
U.S. stock indexes hit multi-week lows on Thursday, as concerns over heavy AI spending resurfaced…
Hi Traders! GBPUSD short term forecast and technical analysis is here. We do our analysis…
Hi Traders! Ethereum short term forecast follow-up and update is here. On May 26th, 2026…
Hi Traders! GBPAUD short term forecast and technical analysis is here. We do our analysis…
Hi Traders! USDCHF short term forecast update and follow up is here. On May 20th,…
View Comments
It's really nice to see such valuable information here Vlad. Thank you so much for making it possible.
Always a pleasure Mark
Thanks for your feedback