Hi Traders! USDJPY forecast update and follow up is here. On May 12th I shared this “USDJPY Forecast” in Trading View. In this post, let’s do a recap of this setup and see how it has developed now. If you would like to learn more about the way we trade and the technical analysis we use then check out the Traders Academy Club. Spoiler alert – free memberships are available!
Missed this trade?
Never miss a trade opportunity again! Join the Traders Academy Club
Now let’s summarize the idea first:
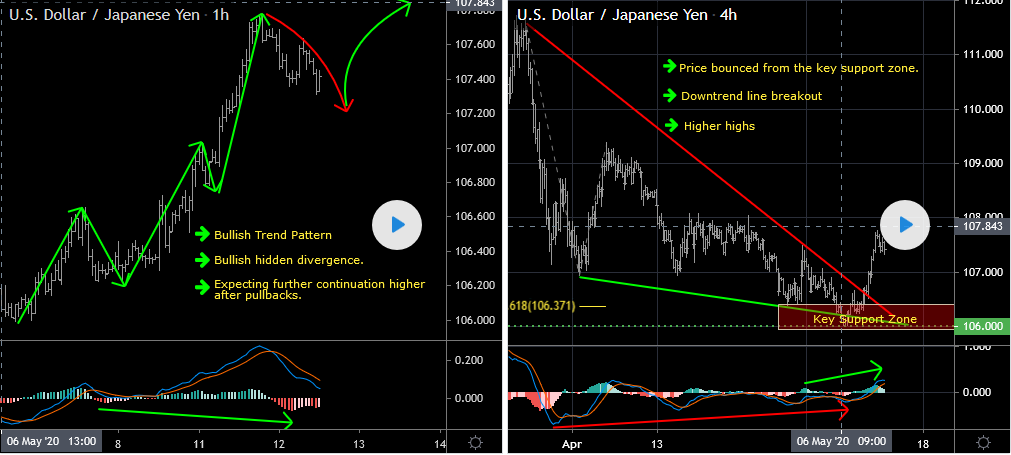
USDJPY – My idea here was as follows:
H4 – Price respected the key support zone formed by the 106 psychological zone, alternative trend line, and the 61.8% (106.371) fibonacci expansion level of the first wave we have.
We also had a false break of the alternative trend line and the last low, bullish divergence.
The price has also broken above the downtrend line and has created higher highs.
H1 – Bullish trend pattern, currently it looks like a pullback is happening. Bullish hidden divergence.
Expecting further continuation higher after pullbacks.
On last Friday (May 15th) in the Weekly Trades Summary post I mentioned an update about this USDJPY forecast which is as follows:
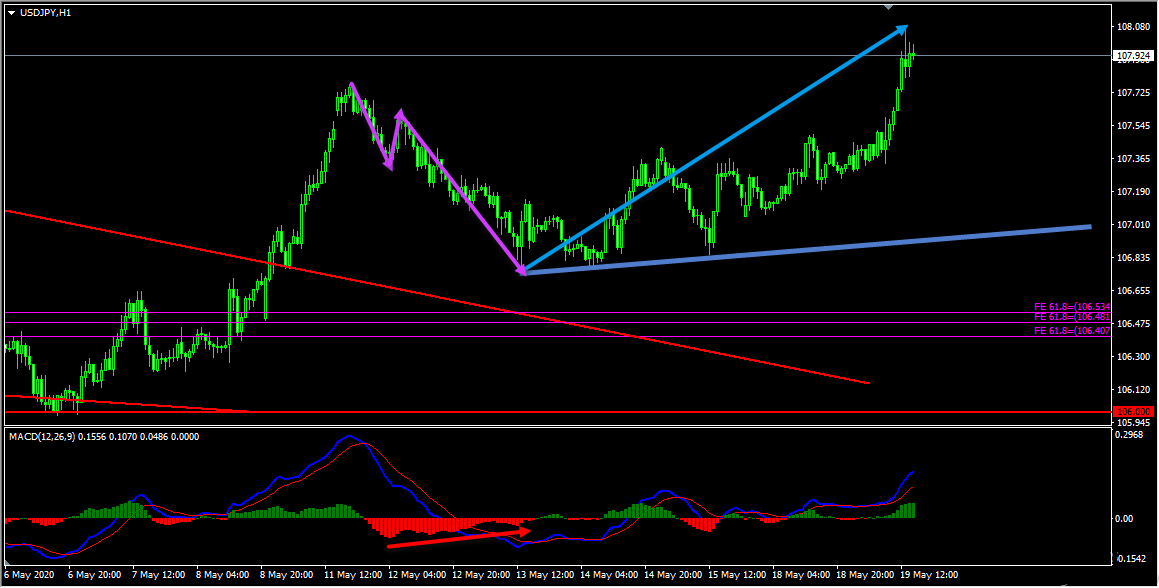
“On the H1 chart we got deeper retraces and then the price is moving higher. Until the uptrend line (marked in blue line) shown in the screenshot below holds my view remains bullish here. If the price moves lower, breaks, and holds below this uptrend line then this bullish view will be invalidated”.
On the H1 chart, the price respected the uptrend line and moved higher again delivering 130+ pips move so far.
As you can see in this pair my view was bullish because on the H4 chart the price respected a key support zone, we had a false break, bullish divergence then the price broke above the downtrend line, and also it had created higher highs.
Also on the H1 chart, we had a bullish trend pattern so all these facts were supporting the bullish view. Based on all this my view here was to look for retraces and then further continuation higher.
The retraces that we were looking for happened but we had deeper retraces. This retrace happened in the form of two waves and we also had continuing bullish divergence so all these facts still supported the bullish view. But the most important fact is that the H4 downtrend line breakout was still holding. Then the price created double wave to the upside and was nearing the most recent uptrend line. This is when I updated on last Friday that this uptrend line would be our invalidation level because break below it would have become an opposite evidence in the form of an ABCD pattern followed by the most recent uptrend line breakout. But the price respected this uptrend line and moved higher perfectly as per my plan.
(Note: You can follow me here on Trading View and also on my blog to get similar ideas on a daily basis)
For similar trade ideas and much more join the Traders Academy Club and get access to our complete watch list and trade report.
This is how the report looks like. A table with the hottest market opportunities, screenshot behind every pair and time frame (anything that is in blue inside the table is clickable and leads to a screenshot) + a summary in text format, kind of highlights. And of course Live Trading Room every single day.
If you have any further questions, don’t hesitate to drop a comment below!
To your success,
Vladimir Ribakov
Certified Financial Technician
Hi Traders! Arvinth here from the Home Trader Club team. The weekly summary and, review of July…
U.S. stock indexes hit multi-week lows on Thursday, as concerns over heavy AI spending resurfaced…
Hi Traders! GBPUSD short term forecast and technical analysis is here. We do our analysis…
Hi Traders! Ethereum short term forecast follow-up and update is here. On May 26th, 2026…
Hi Traders! GBPAUD short term forecast and technical analysis is here. We do our analysis…
Hi Traders! USDCHF short term forecast update and follow up is here. On May 20th,…