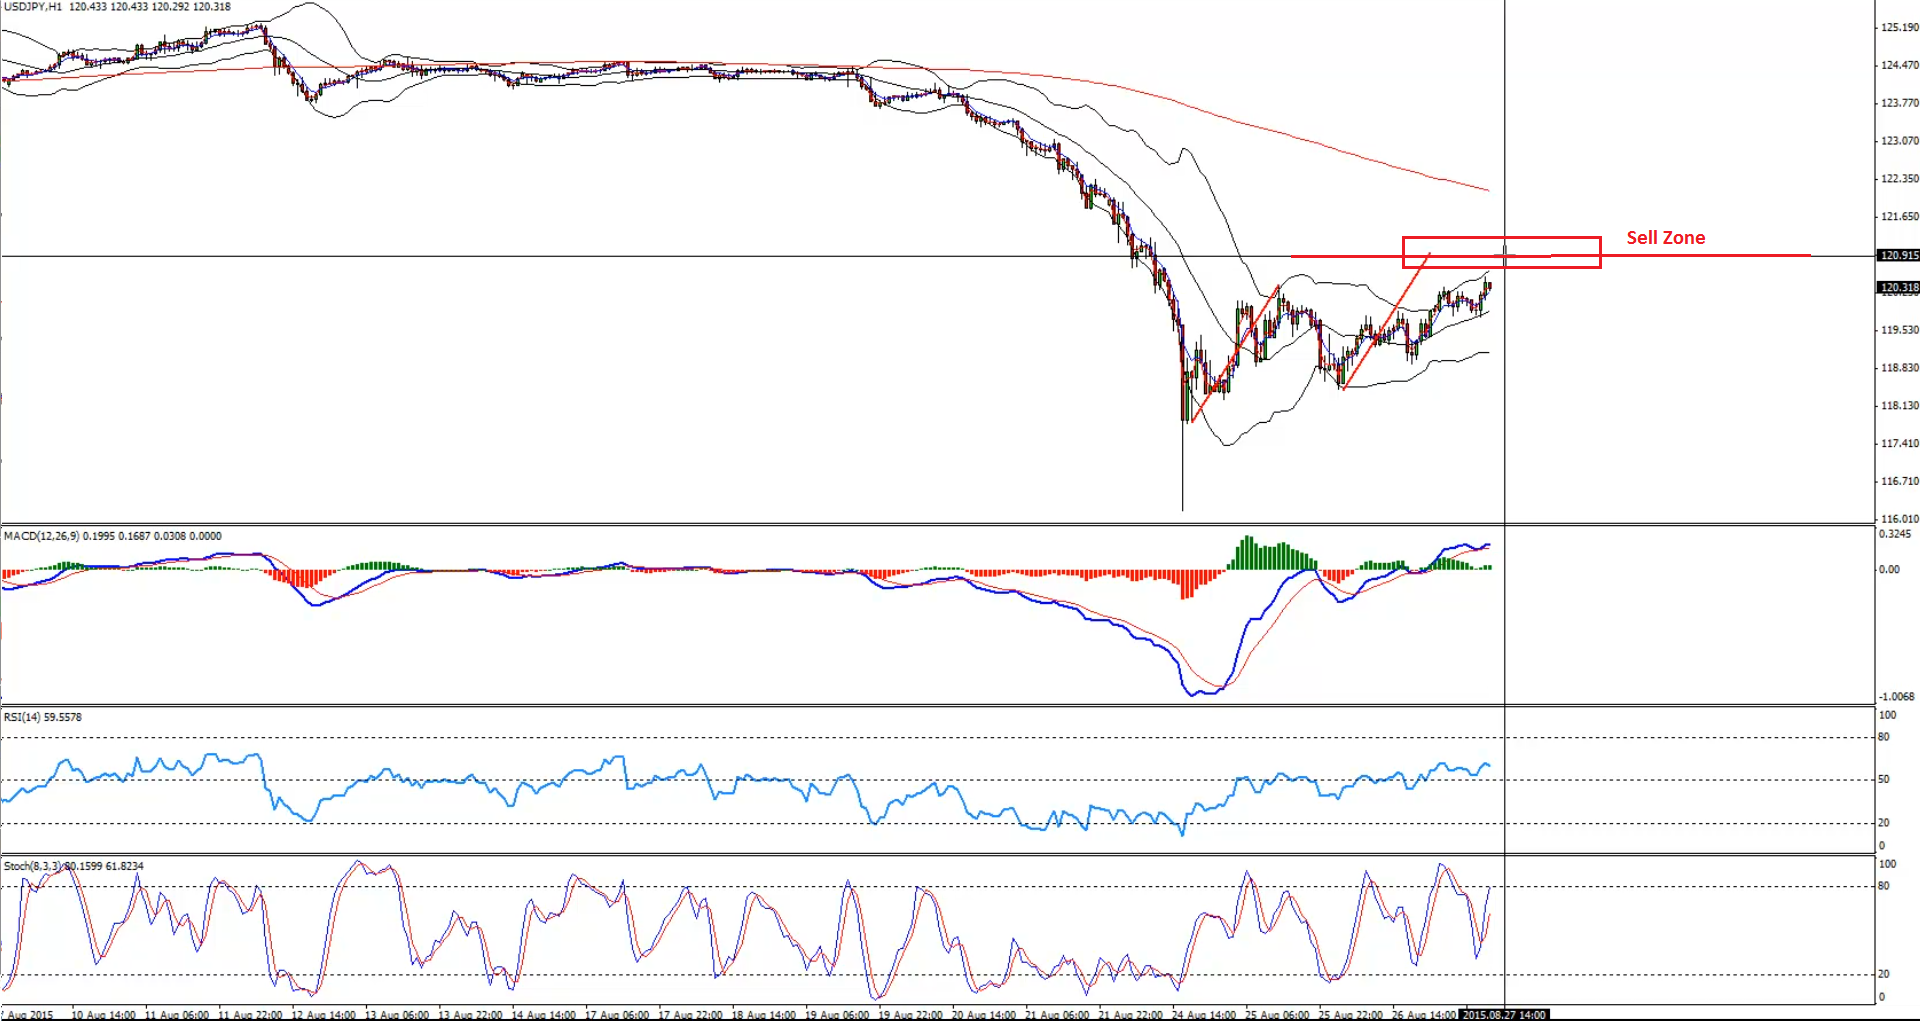
We remain bearish on the USDJPY pair, and I think the pair might continue to trade lower. The pair is currently correcting higher, and it looks like it is forming a wave duplication pattern which could complete near 121.00 where we can plan on entering a sell trade. So, we can wait for the pair to trade higher to enter a trade.
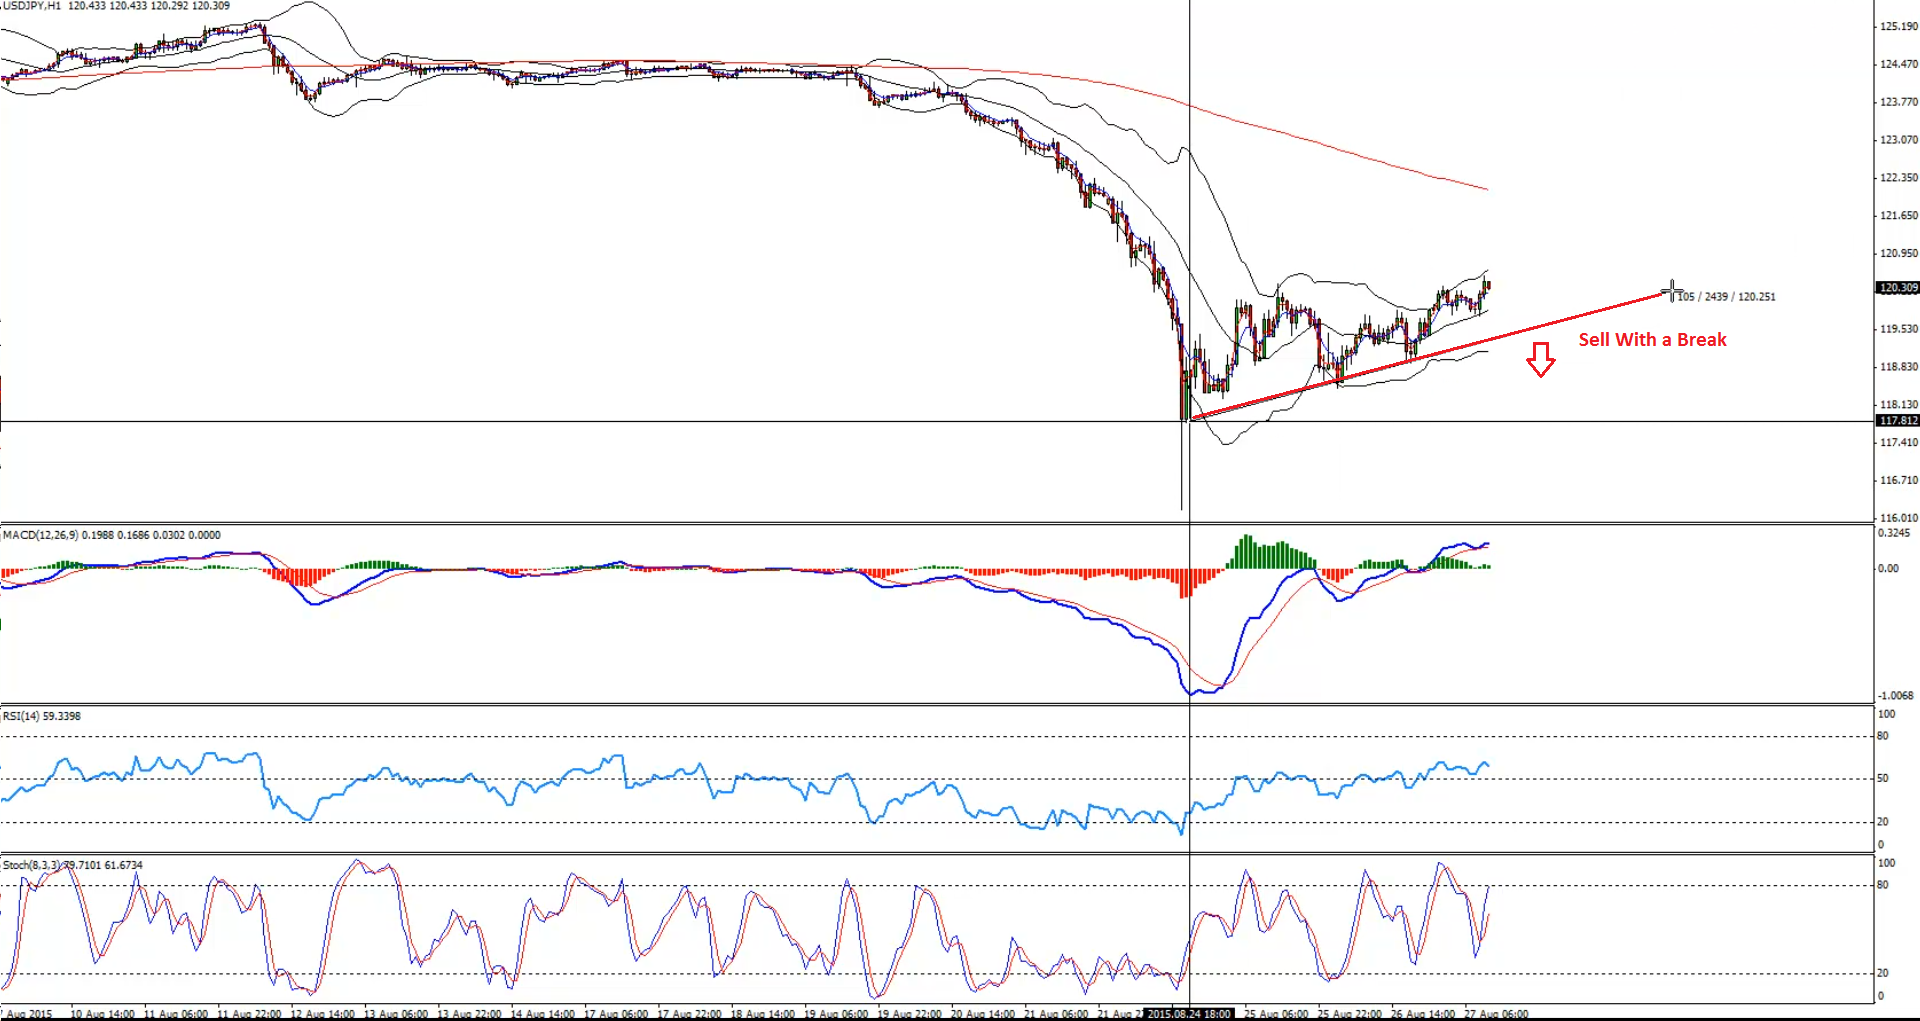
Alternatively, if the pair trades lower from the current levels, then we can look to enter a sell trade with a break. There is a bullish trend line formed on the hourly chart, which can fulfil our purpose.
Technical Analysis
Entry
H1– Chart highlighting the 121.00 resistance area for a sell entry.
Alternative Entry:
H1– We can enter a sell trade in the USDJPY moves lower, breaks the highlighted trend line and settles below it.
Target 1: 118.00
Target 2: 116.50
Stop Loss: Above the last high created before entering the trade
Video Explanation:
Yours,
Vladimir
Hi Traders! Arvinth here from the Home Trader Club team. The weekly summary and, review of March…
Europe’s bonds will struggle to bounce back from a sharp selloff triggered by the war…
Hi Traders! GBPUSD short term forecast and technical analysis is here. We do our analysis…
Hi Traders! SP500 short term forecast update and follow up is here. On December 18th,…
Hi Traders! AUDNZD short term forecast and technical analysis is here. We do our analysis…
Hi Traders! USDJPY short term forecast update and follow up is here. On January 29th,…