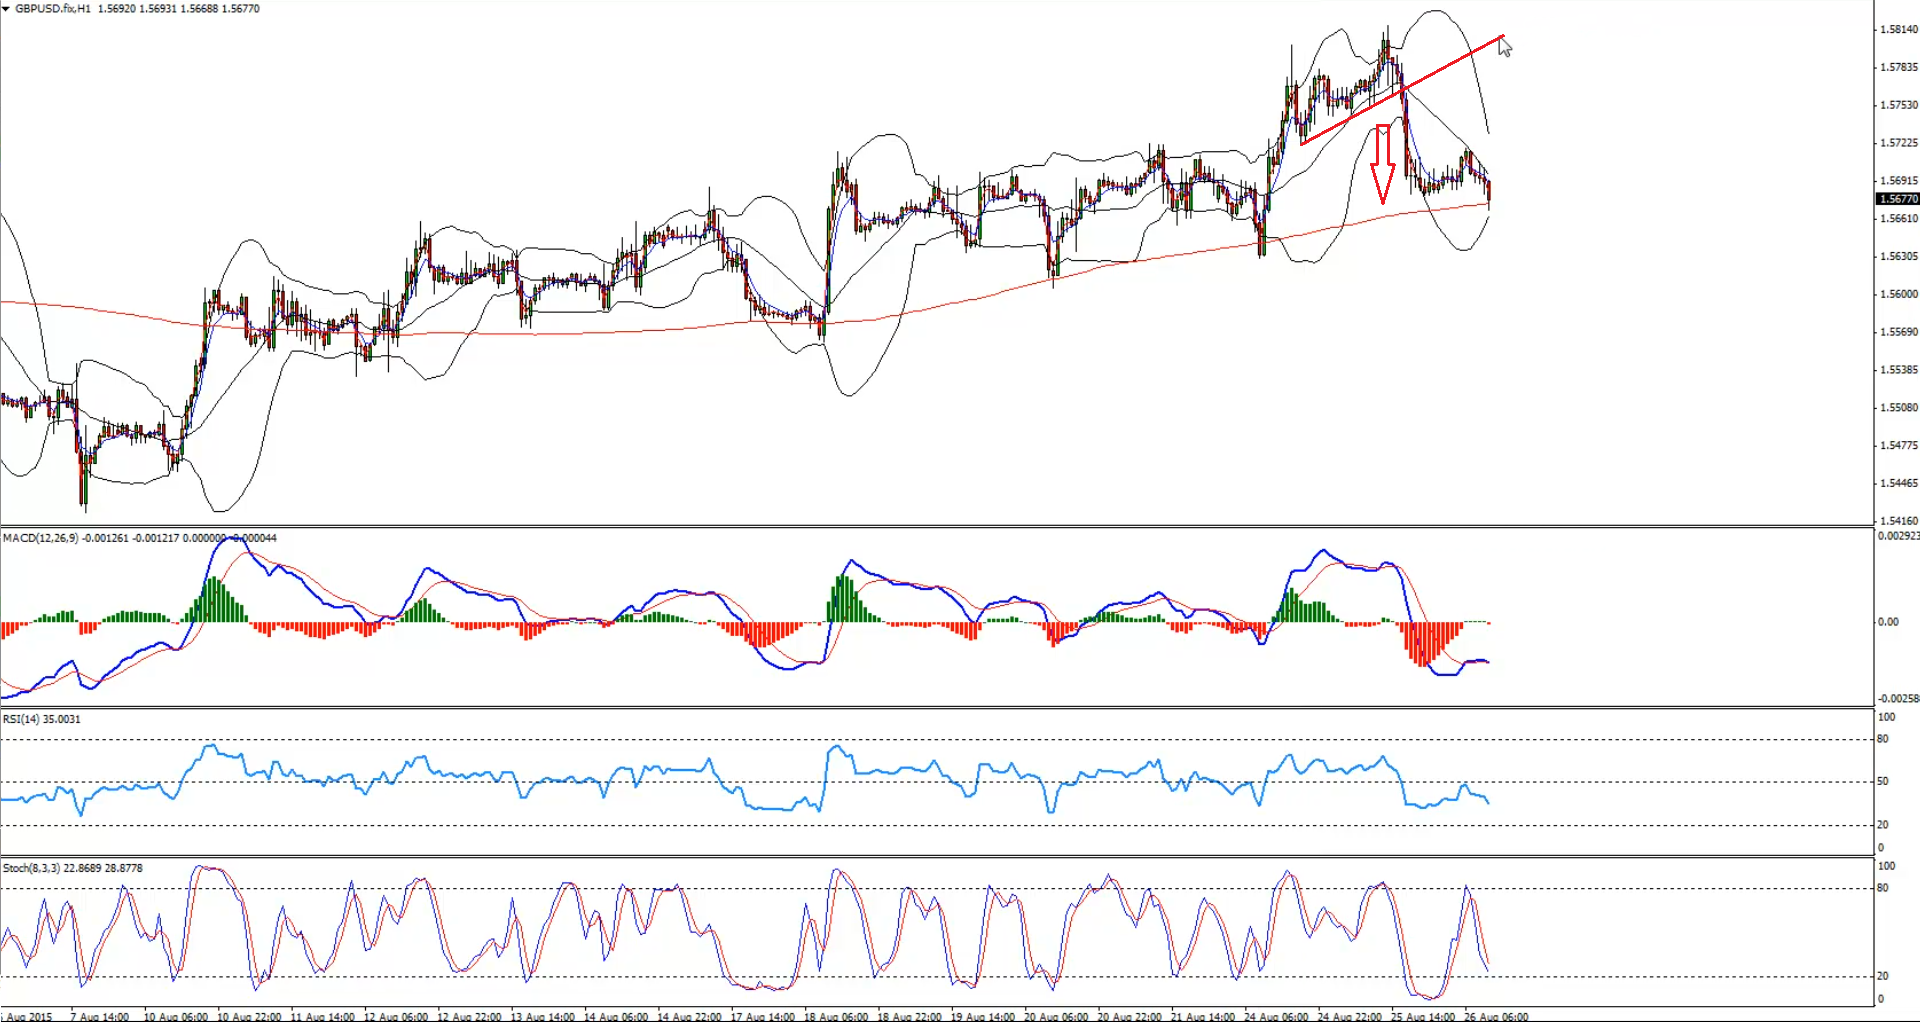
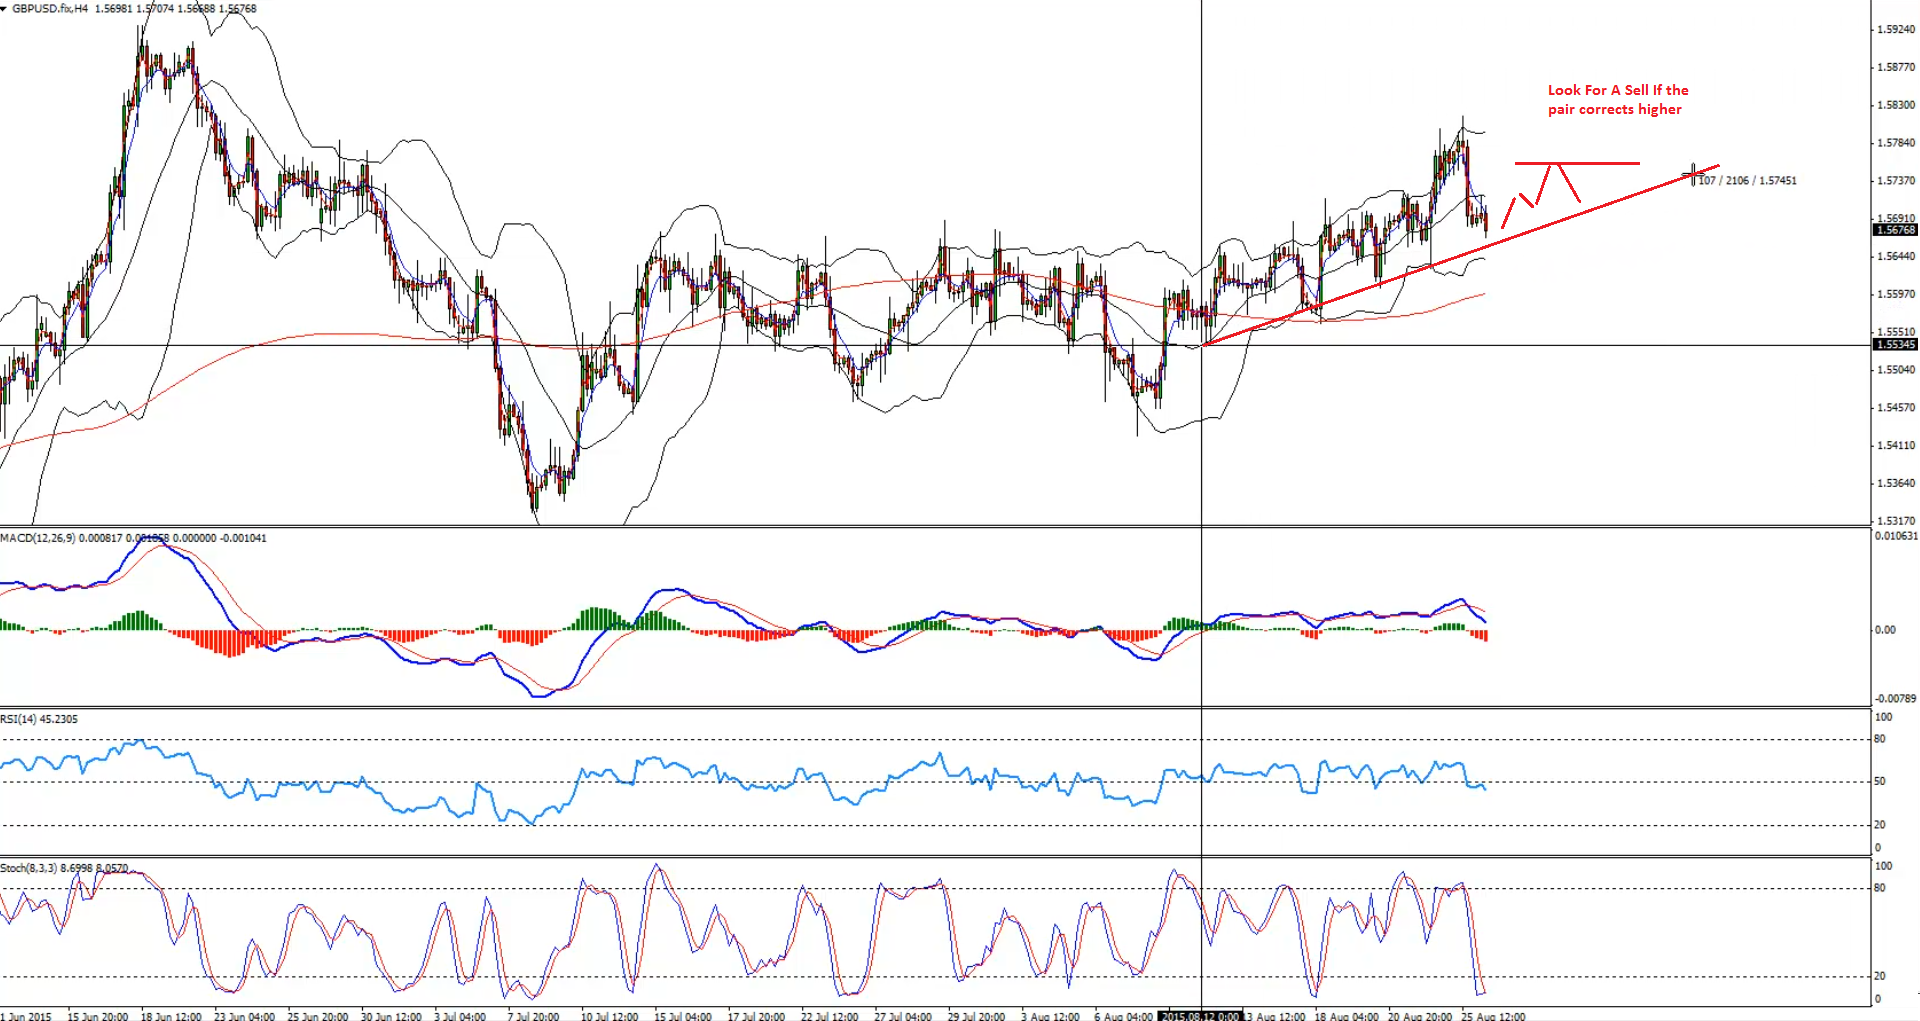
We were looking for sell opportunities in the GBPUSD pair, and we got one recently. There was a trend line break on the hourly chart, which was a signal for us to enter a sell trade. It played well. Now, I think we are heading towards a support area on the 4-hours chart in the form of a bullish trend line. So, if the pair trades near it, there is a chance of buyers appearing around the trend line support for a push higher.
So, I think if the pair find buyers and corrects higher, then we might look to enter a sell trade once again in the short term.
Technical Analysis
H1– Chart highlighting the trend line break and a successful sell trade.
Entry:
H4– We can enter a sell trade in the GBPUSD if it moves closer to the highlighted trend line, finds support and corrects higher in two waves.
Target 1: 1.5680
Target 2: 1.5640
Stop Loss: Above the last high created around 1.5810
Video Explanation:
Yours,
Vladimir
GDP growth is one of the most important indicators of economic health. But does stronger…
When it comes to fundamental Forex analysis, few institutions matter as much as the Federal…
Interest rates are one of the most important fundamental forces in the Forex market. But…
The latest U.S. employment report has delivered a significant warning for the market. With only…
The Forex market does not always offer clear trading opportunities. Sometimes, price moves sharply in…
Open social media for a few minutes and you can easily find someone talking about…