Guest Post by Nicola Delic
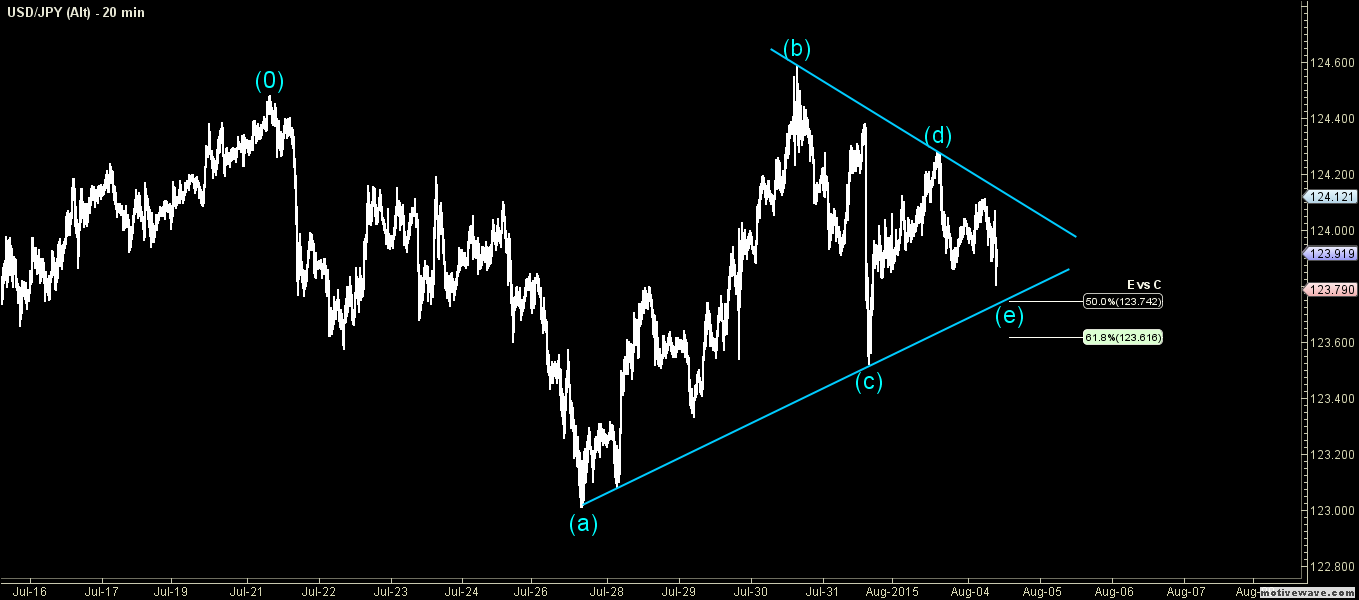
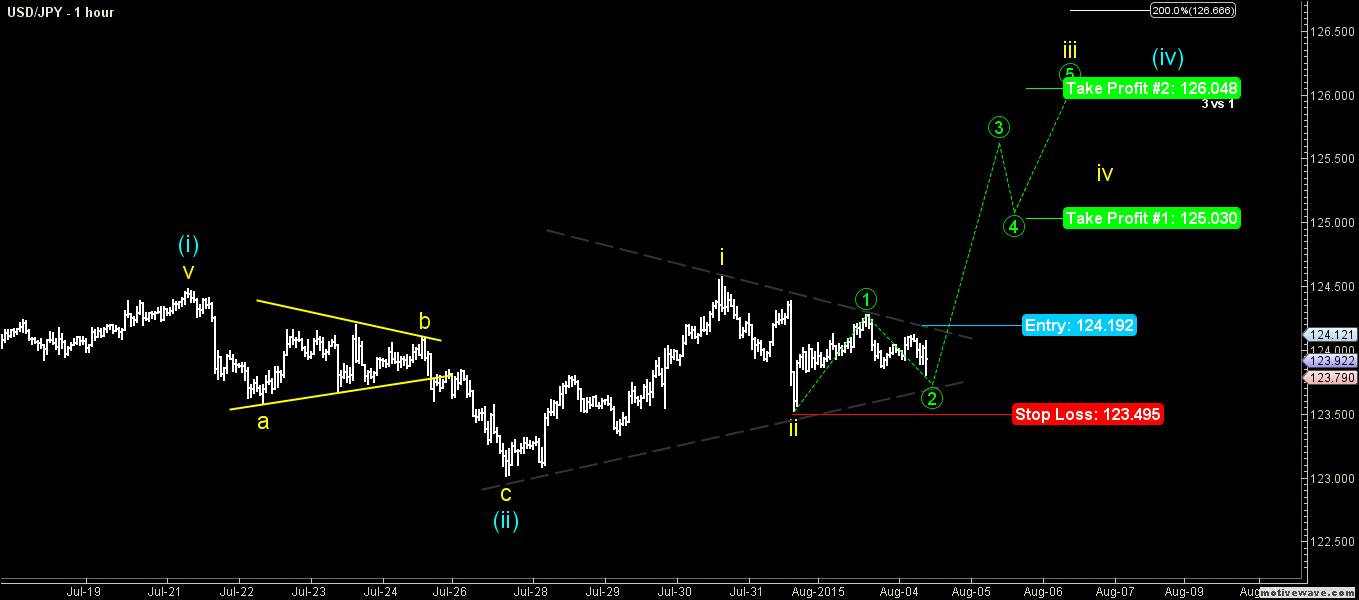
The US Dollar looks like forming a nice bullish pattern against the Japanese Yen. There is also a triangle pattern formed on the hourly chart of the USDJPY pair, which if breached towards the upside might clear the way for more gains moving ahead. The pair is likely in the second wave inside the triangle and if the triangle resistance is cleared it might head towards the 125.00 at least.
So, I think we should wait for a break, and then enter a buy trade. The greenback is under bullish pressure which favors more upsides in USDJPY.
Technical Analysis
20 Min– Chart representing the triangle structure as investors wait for a break.
Entry:
H1– We can enter a buy trade for USDJPY once the triangle resistance area is cleared and the pair settle above it.
Target 1: 125.00
Target 2: 126.00
Stop Loss: Below 123.50
Video Explanation:
Hi Traders! Arvinth here from the Home Trader Club team. The weekly summary and, review of July…
U.S. stock indexes hit multi-week lows on Thursday, as concerns over heavy AI spending resurfaced…
Hi Traders! GBPUSD short term forecast and technical analysis is here. We do our analysis…
Hi Traders! Ethereum short term forecast follow-up and update is here. On May 26th, 2026…
Hi Traders! GBPAUD short term forecast and technical analysis is here. We do our analysis…
Hi Traders! USDCHF short term forecast update and follow up is here. On May 20th,…