EURUSD, GBPUSD, USDJPY, Gold and Bitcoin remain at important technical levels as volatility and geopolitical uncertainty continue to influence the markets.
The message across several of the major markets is simple: sell the rallies.
EURUSD and GBPUSD continue to show bearish price structures, USDJPY remains under pressure while its key resistance zone holds, Gold is still showing signs that its larger bearish correction may not be complete, and Bitcoin is approaching major supply zones where reversal opportunities could develop.
At the same time, traders should remain aware that geopolitical developments can quickly change market sentiment and create sharp, unexpected moves.
We have partnered with AvaTrade, one of the industry’s leading regulated brokers.
When you open and trade with AvaTrade through our partnership, you receive:
If you’re looking to accelerate your trading journey while enjoying premium education, this partnership gives you everything you need under one roof.
If you already have account with them, still follow this link to open separate account with separate email. Once you did that, contact me with the telegram link below and we will give you the access.
Let’s take a closer look at the charts and the key levels to watch during the week ahead.
The market is entering another sensitive period.
Geopolitical tensions remain an important factor for financial markets, with developments involving the Middle East, Russia and Europe, the United States and other major global players continuing to influence risk sentiment.
These developments can create significant volatility across currencies, commodities and cryptocurrencies.
From a technical perspective, however, the charts continue to provide a clearer framework.
For this week’s analysis, the primary approach across several markets is:
Look for rallies into resistance and watch for bearish reversal signals before considering short opportunities.
This does not mean selling blindly.
The objective is to wait for price to reach important technical areas and then look for confirmation from price action, divergence, trendlines or other reversal signals.
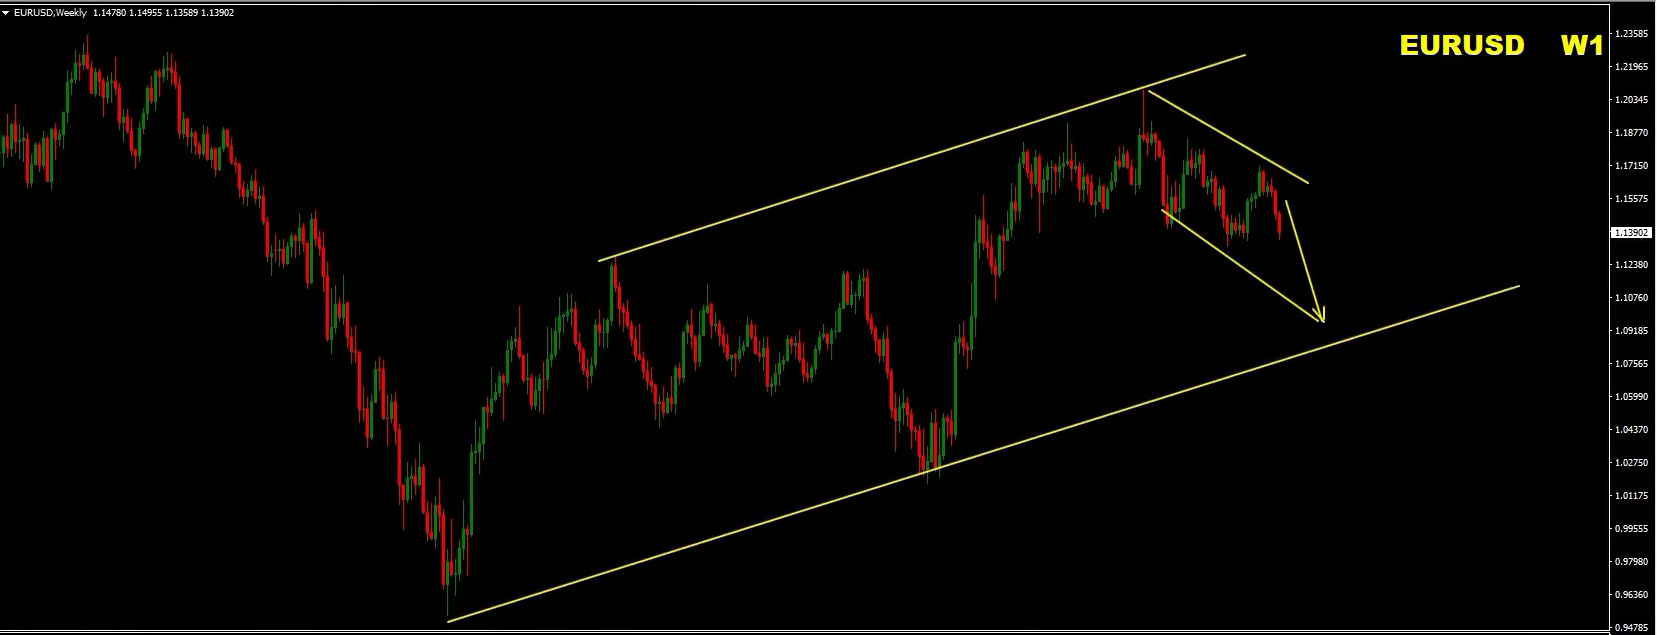
EURUSD continues to trade within a bearish technical structure.
The pair remains inside a descending channel, with price producing a sequence of lower highs and lower lows.
This structure continues to favor the downside.
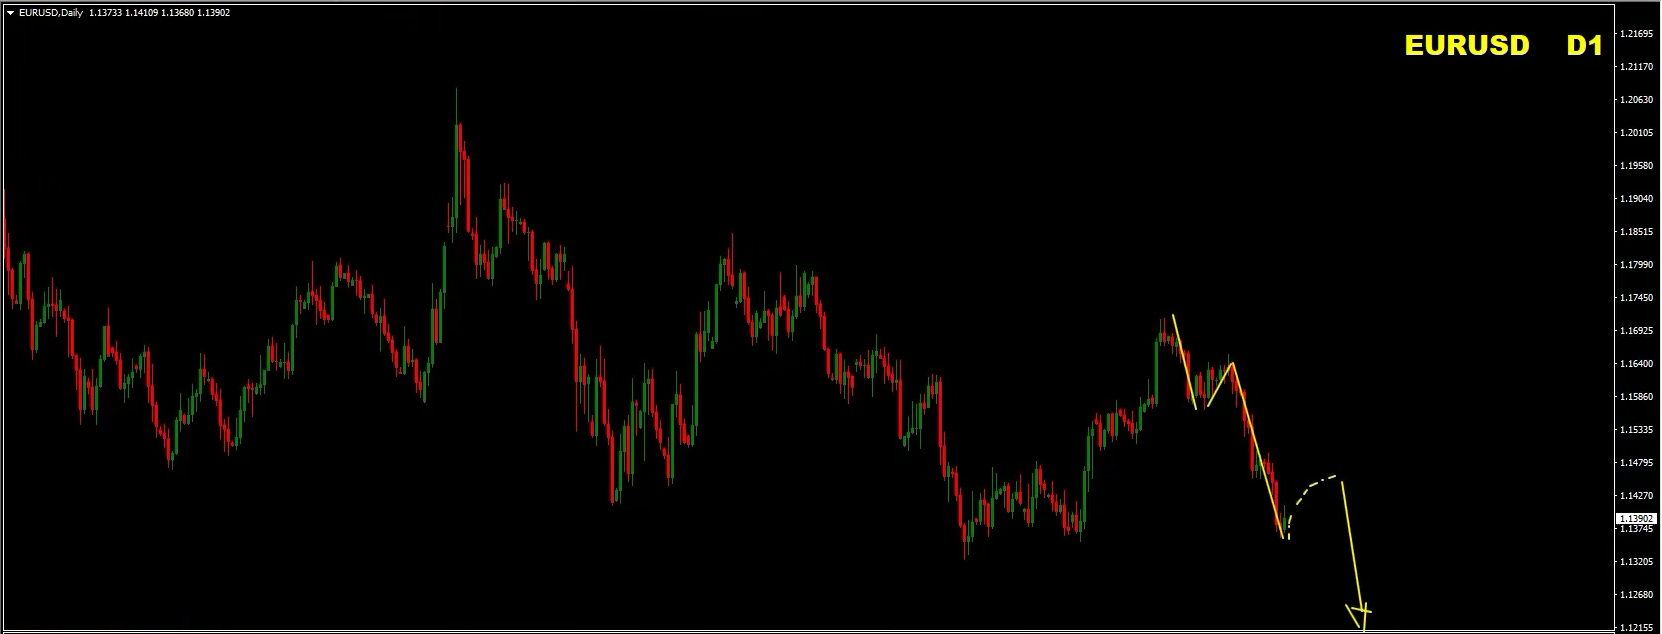
The daily chart also supports the bearish view, although traders should be prepared for temporary pullbacks before another potential leg lower.
One of the important observations on the daily chart is the continued formation of lower highs and lower lows.
At the same time, RSI is approaching conditions where a short-term pullback could develop.
This is important because a pullback does not necessarily invalidate the bearish structure.
Instead, a rally toward resistance could provide another opportunity to look for bearish setups.
The major downside areas to watch include:
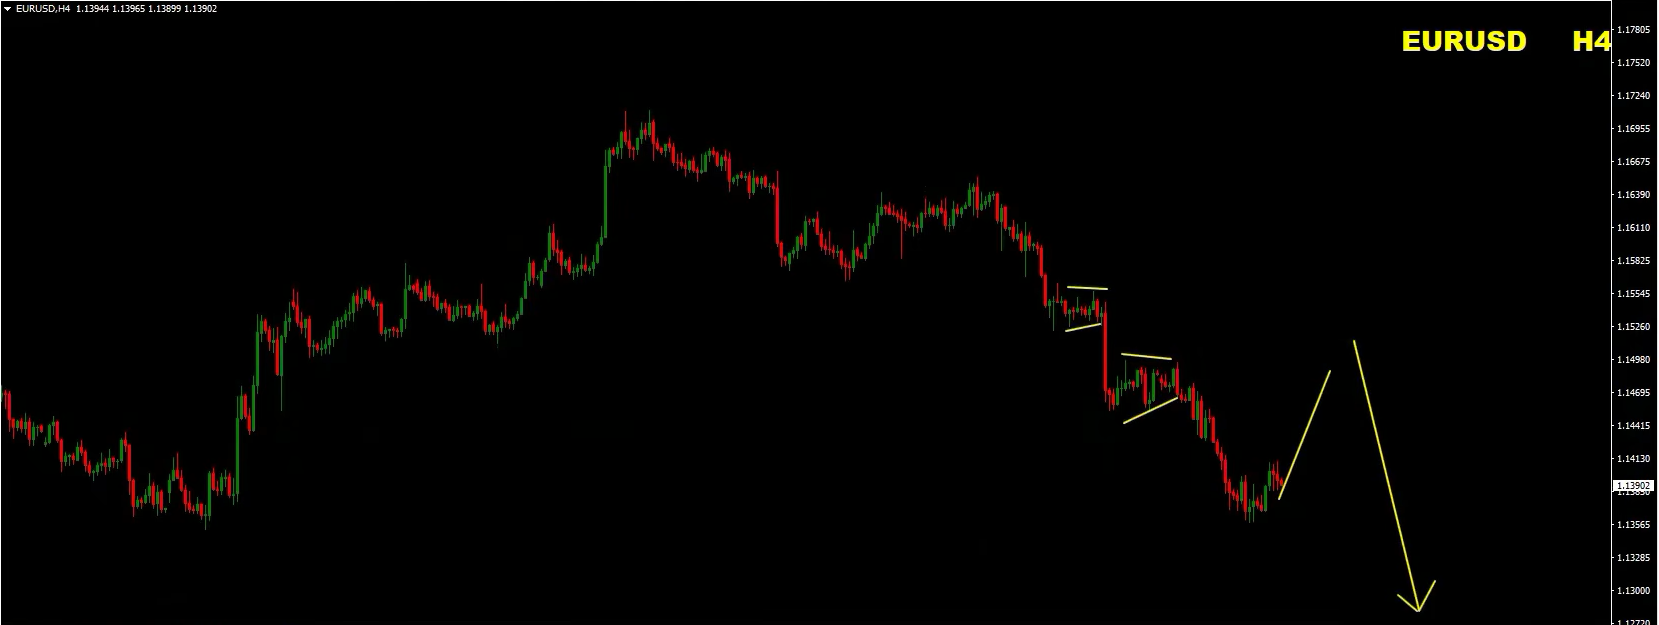
There are two primary scenarios to watch.
Scenario 1 – Pullback First
EURUSD could begin the week with a recovery toward one of the nearby resistance zones.
If price reaches resistance and produces bearish reversal confirmation, traders can then look for a continuation lower.
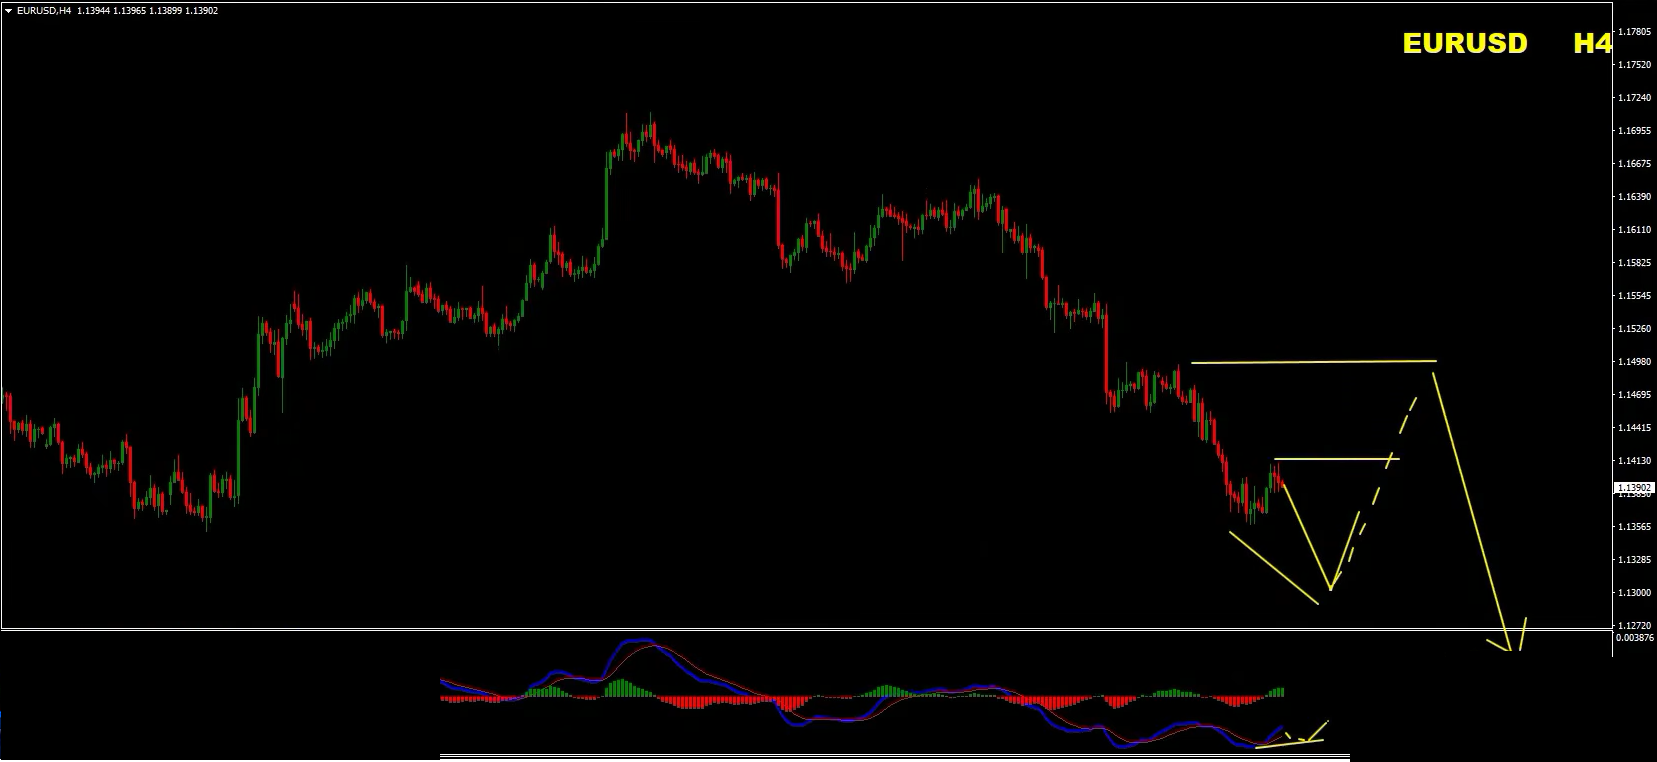
Scenario 2 – Another Immediate Drop
Alternatively, EURUSD could continue falling at the beginning of the week.
If another downside move creates bullish divergence on the lower timeframe, a corrective pullback could follow.
That pullback could retest previous highs or resistance zones.
From there, the bearish trend could potentially resume.
As long as the bearish structure remains intact:
Sell the rallies.
The key is not to chase the market after a large bearish candle. Instead, wait for a pullback into resistance and look for confirmation.
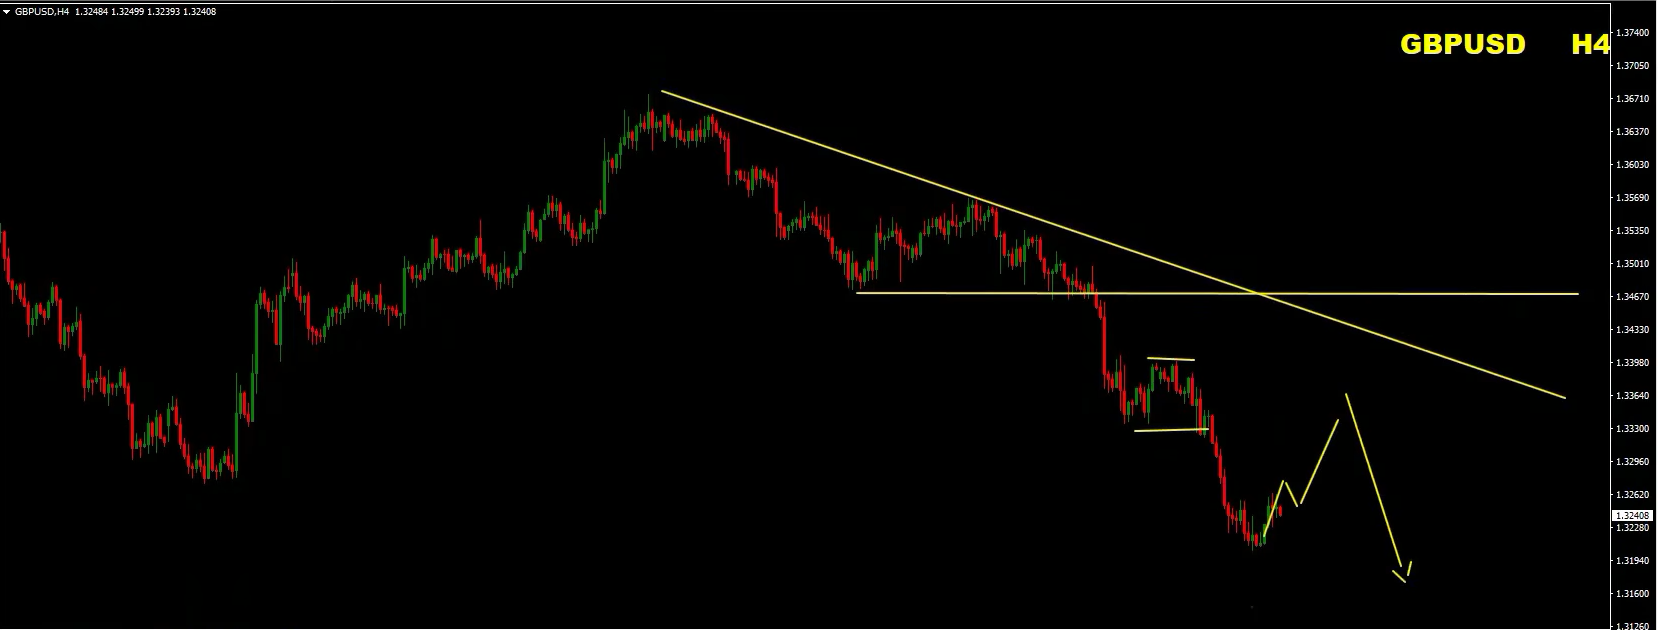
GBPUSD is showing a technical structure similar to EURUSD.
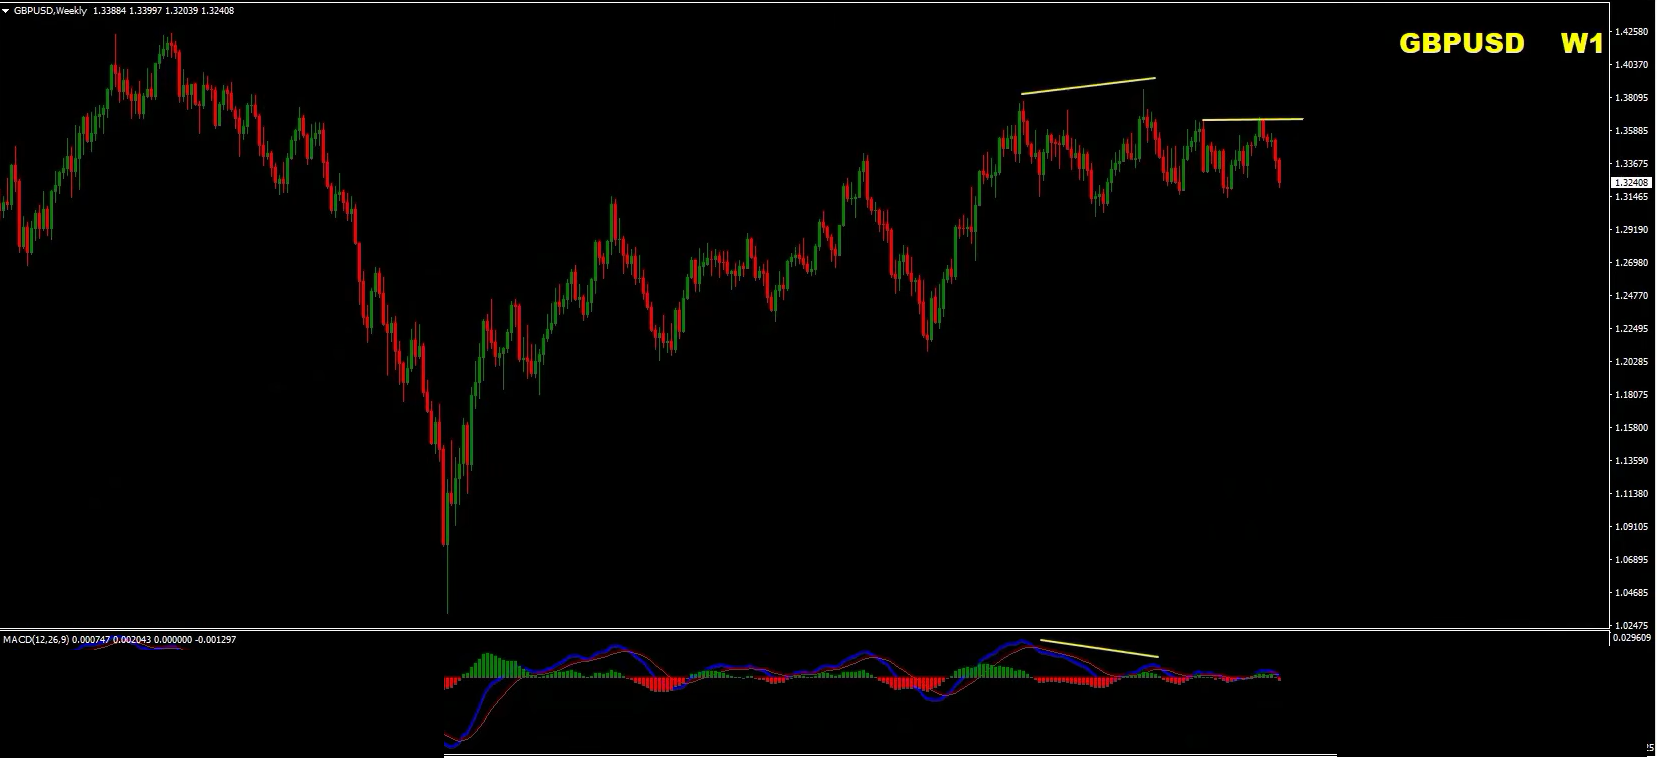
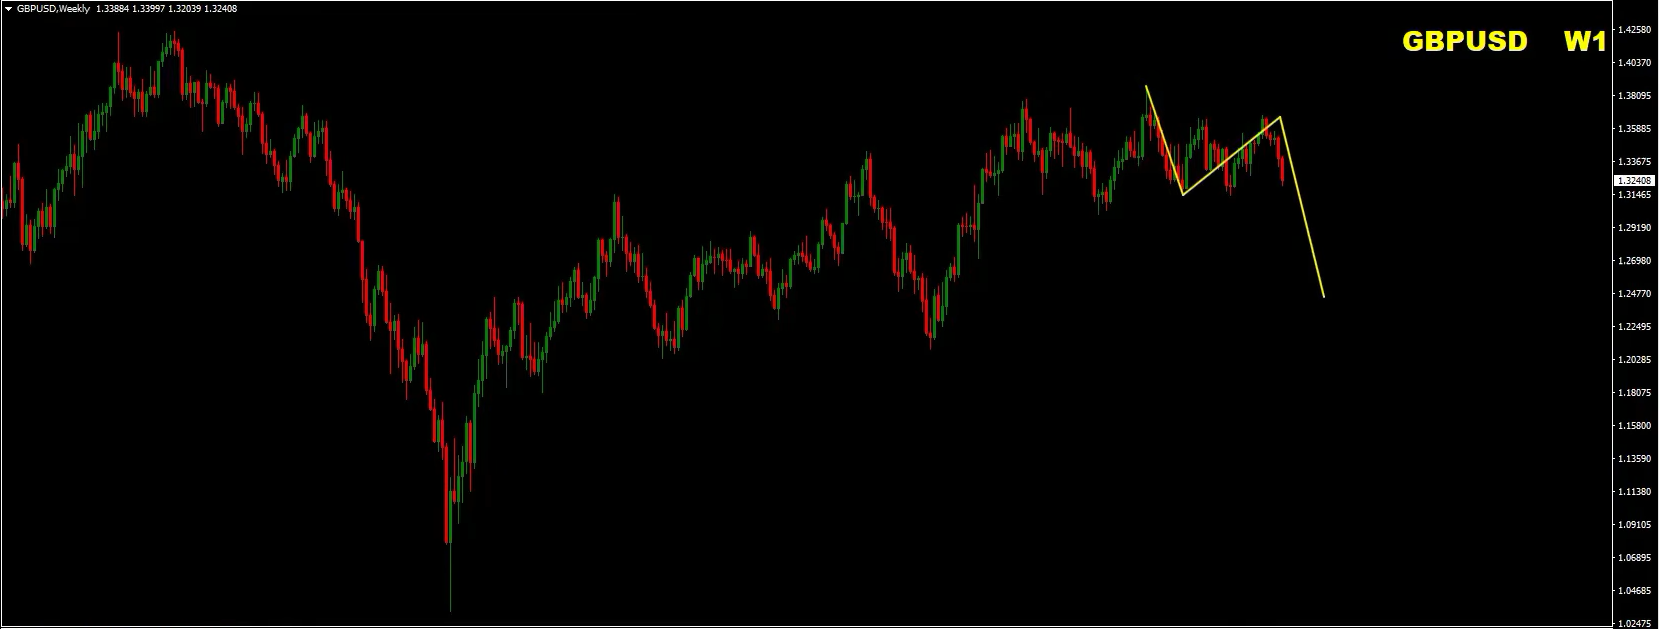
The pair has failed to maintain its previous highs and is now showing signs of a potentially larger corrective structure.
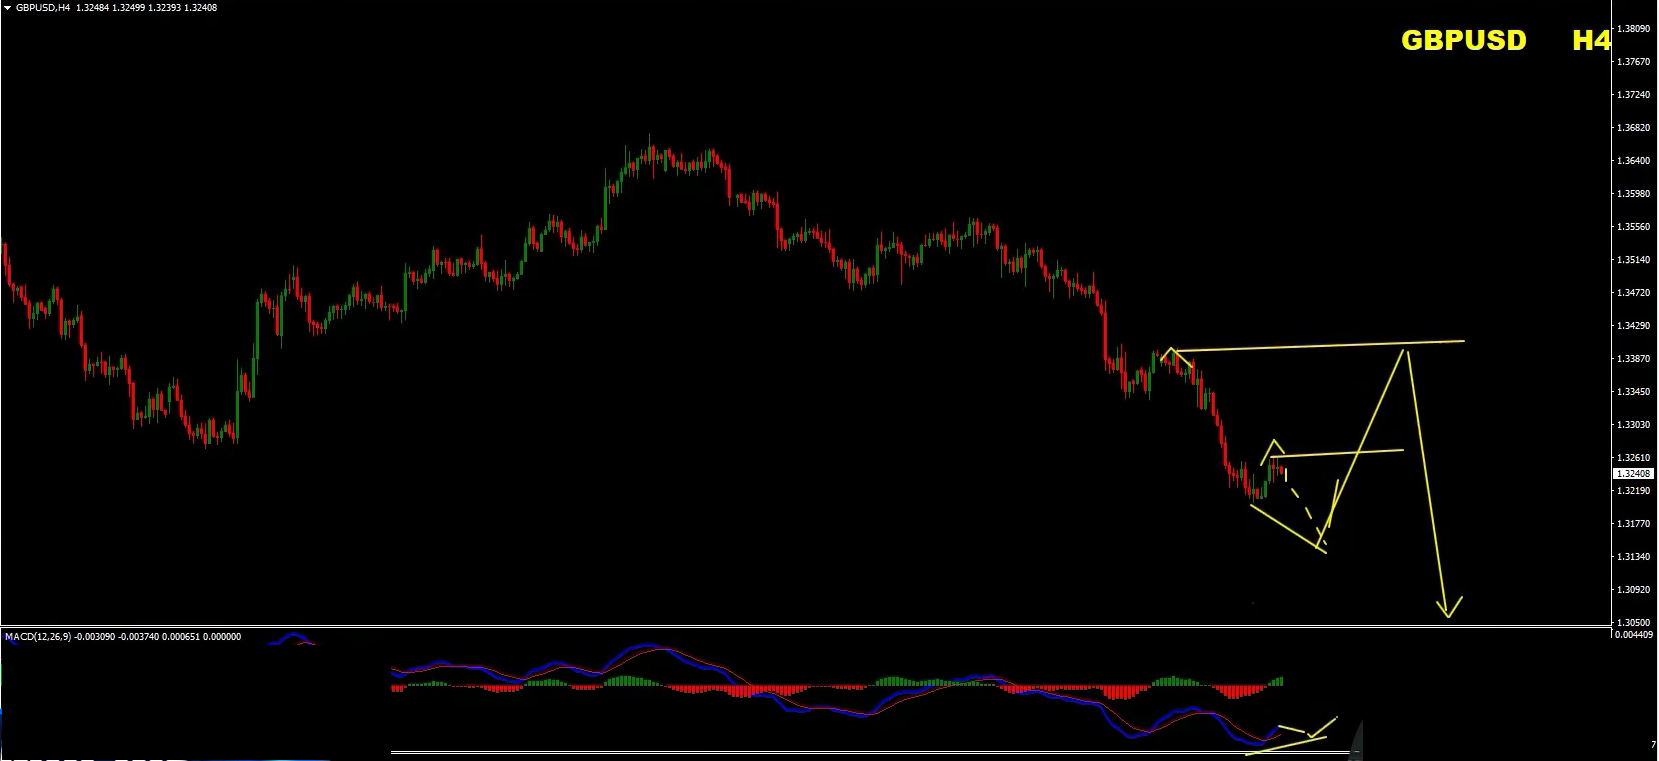
The return of bearish divergence is particularly important.
From a longer-term perspective, the 1.40 area remains an important level to watch.
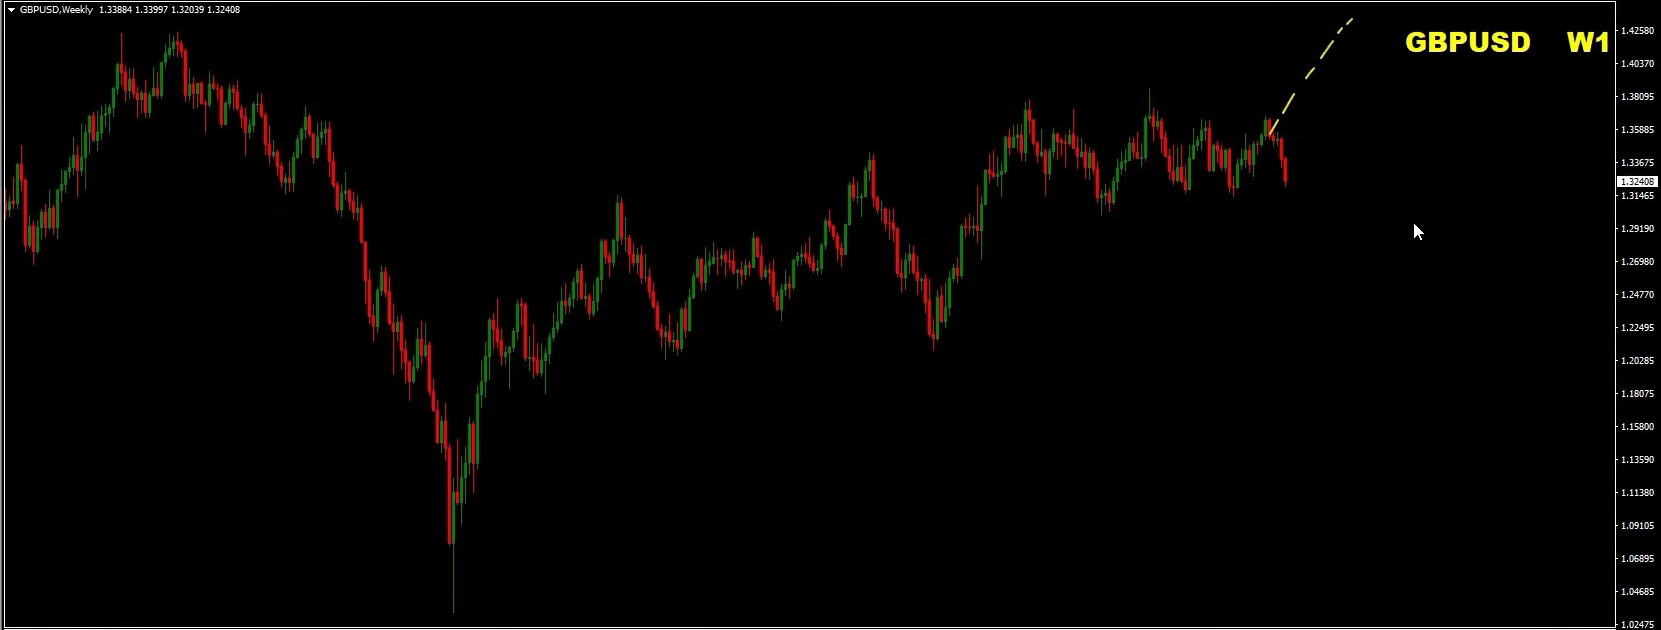
If the broader bullish structure eventually returns, GBPUSD could potentially challenge that area again.
However, the short-term chart currently suggests that more downside could develop first.
The daily chart has broken its previous trendline and is forming:
Lower highs + lower lows
This keeps the short-term bearish structure intact.
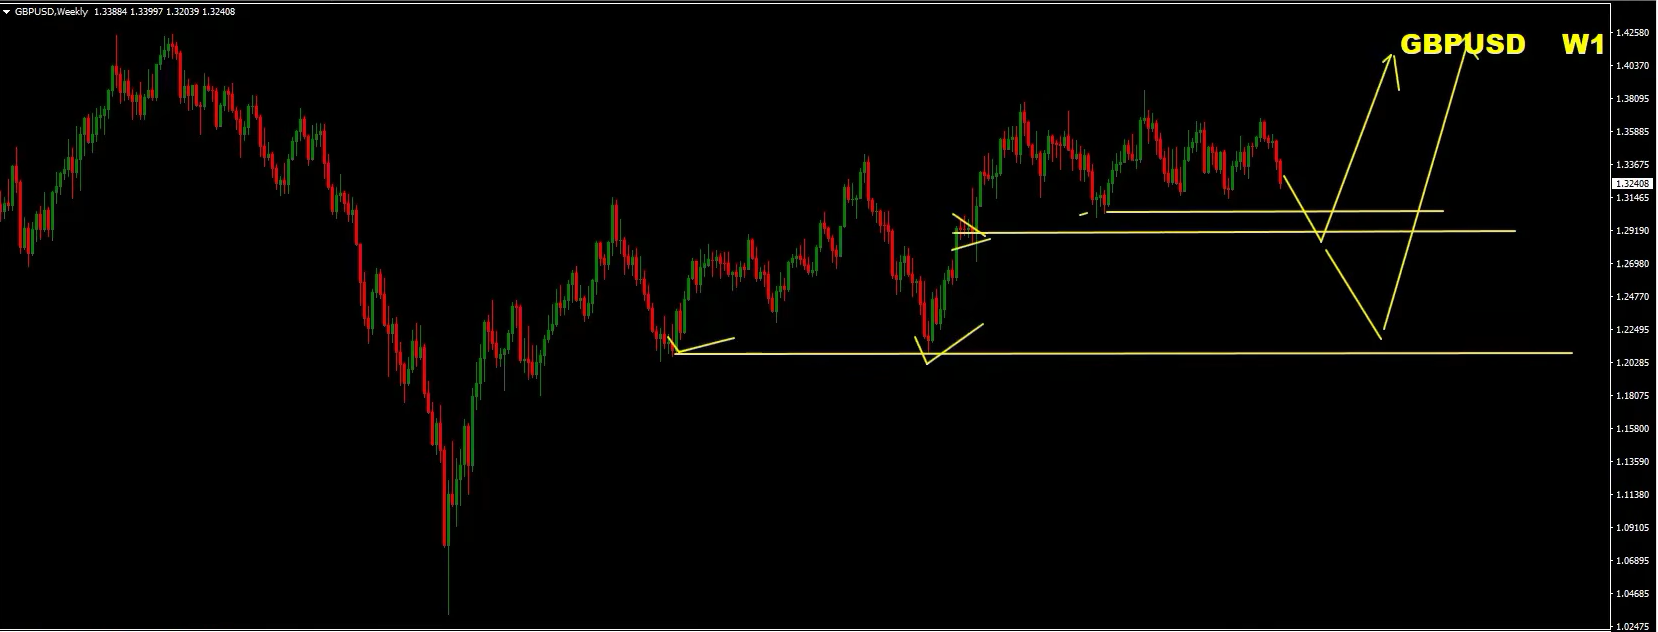
The first major downside area is around:
The 1.20 region would represent a significantly larger correction and should not be treated as an immediate target without further confirmation.
Scenario 1 – Pullback Into Resistance
If GBPUSD begins the week with a recovery, watch the previous consolidation area and the falling resistance line.
A bearish reversal from these areas could create a potential short setup.
Scenario 2 – Immediate Sell-Off
If GBPUSD continues falling immediately, traders should be careful about chasing the move.
A strong downside move could create bullish divergence.
If that happens, a corrective rally toward previous highs or resistance could develop.
That rally could then become another area to watch for bearish confirmation.
The short-term technical structure remains bearish.
Therefore:
Sell the rallies while the bearish structure remains intact.
The important point is to wait for price to come to resistance rather than entering simply because the market is falling.
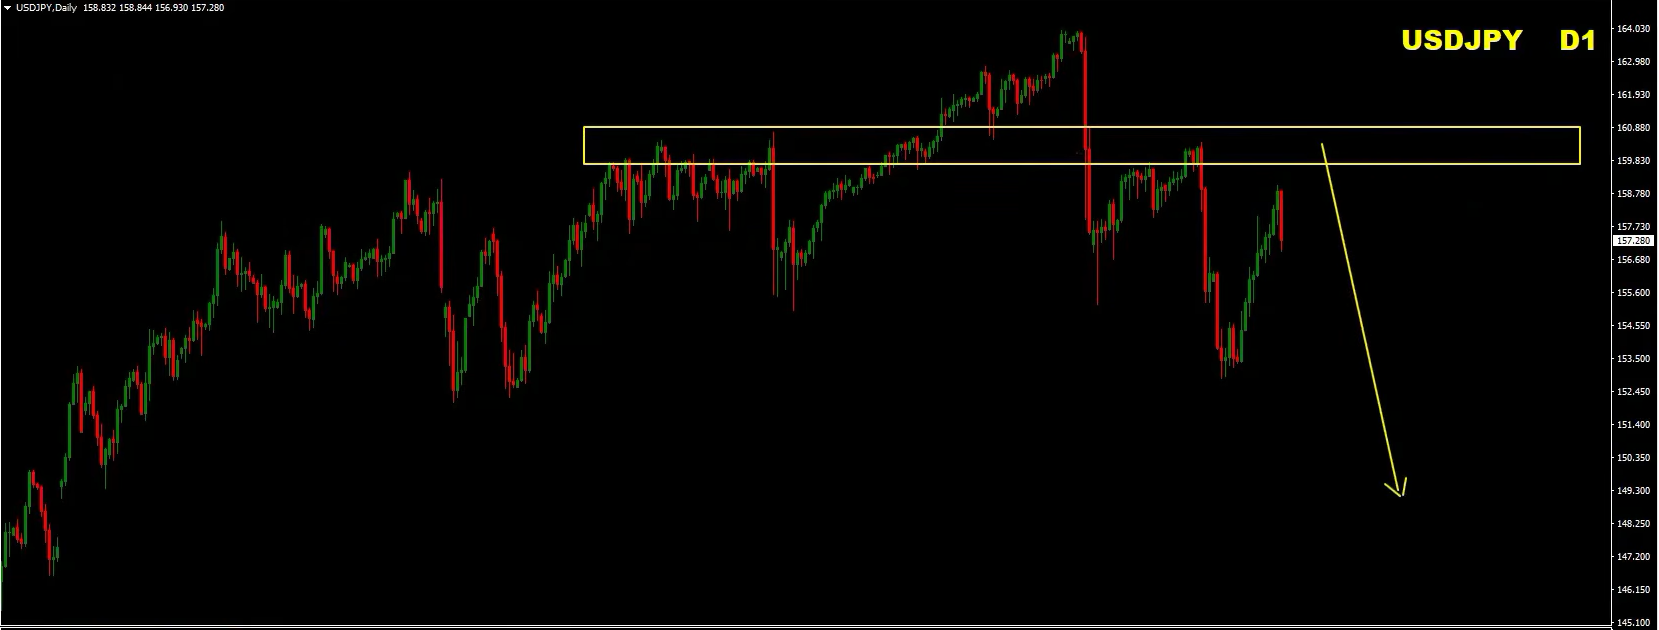
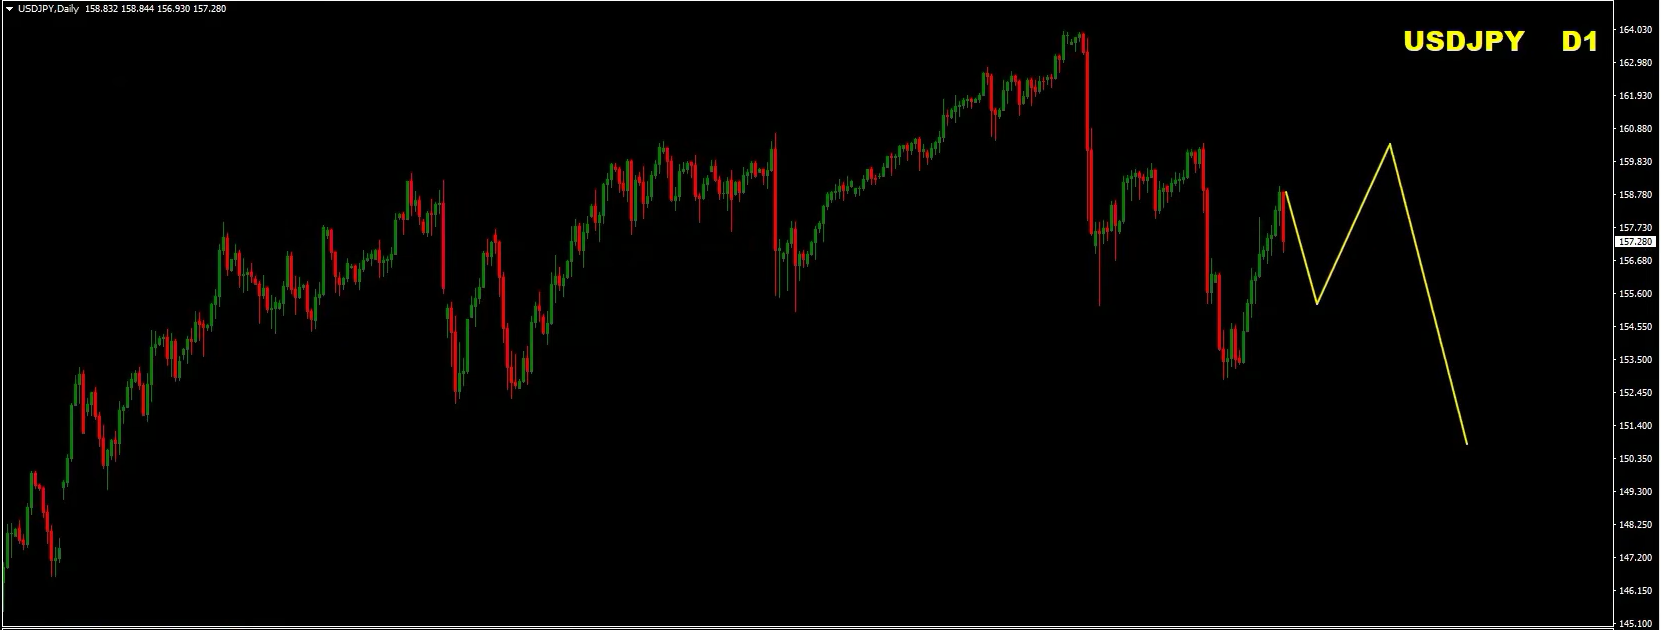
USDJPY remains one of the key charts to watch this week.
The important feature is the major resistance zone discussed in the previous analysis.
That zone remains critical.
As long as price stays below this area, the bearish scenario remains valid.
The main question for USDJPY is simple:
Can price break and hold above the key resistance zone?
If the answer remains no, the bearish structure continues to have room to develop.
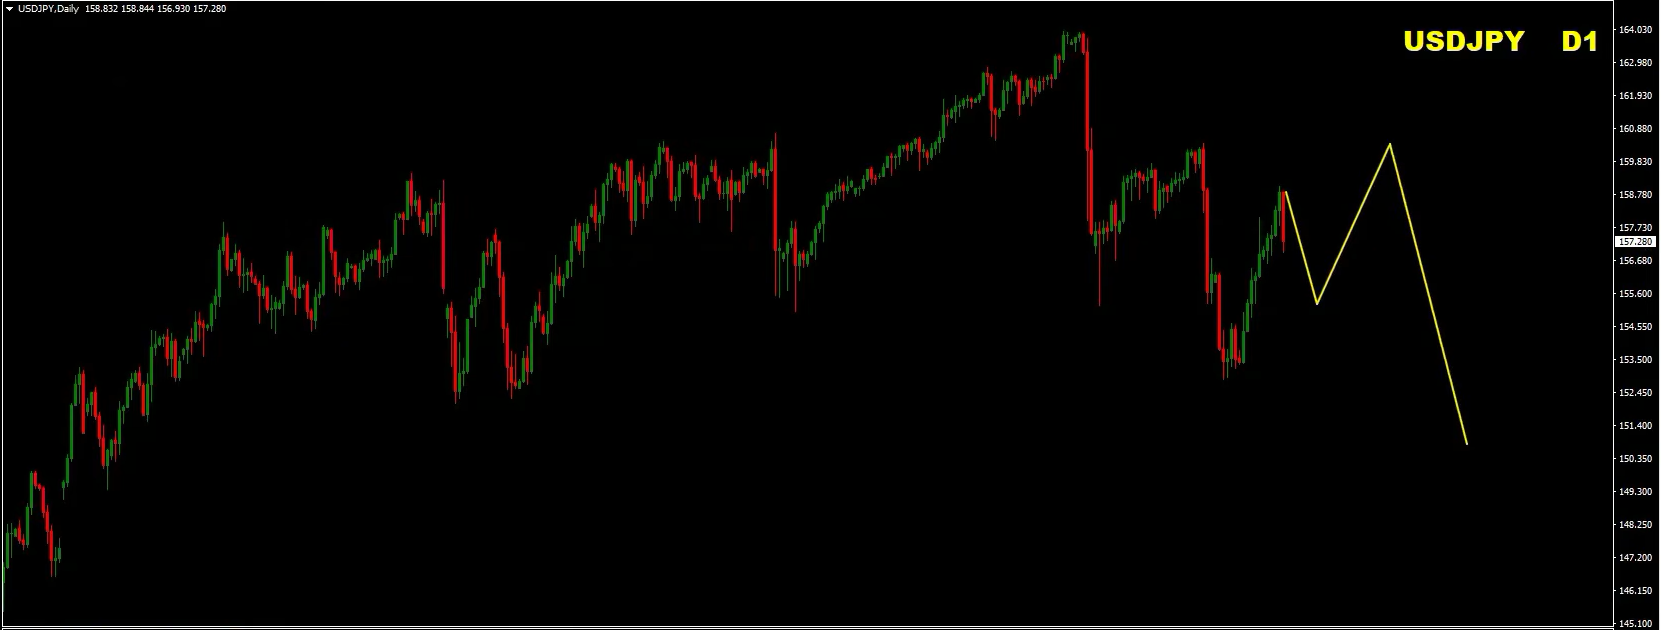
Two possible patterns could emerge.
The first is an ABCD-type corrective structure.
The second is a consolidation or range followed by another major downside move.
If the resistance zone continues to hold, the market could potentially retest:
These are technical reference areas rather than guaranteed targets.
For now, the technical view remains bearish while the key resistance zone holds.
Therefore, traders can continue watching for:
Rallies into resistance → bearish confirmation → potential downside continuation.
A sustained breakout and acceptance above the key resistance area would require the bearish scenario to be reassessed.
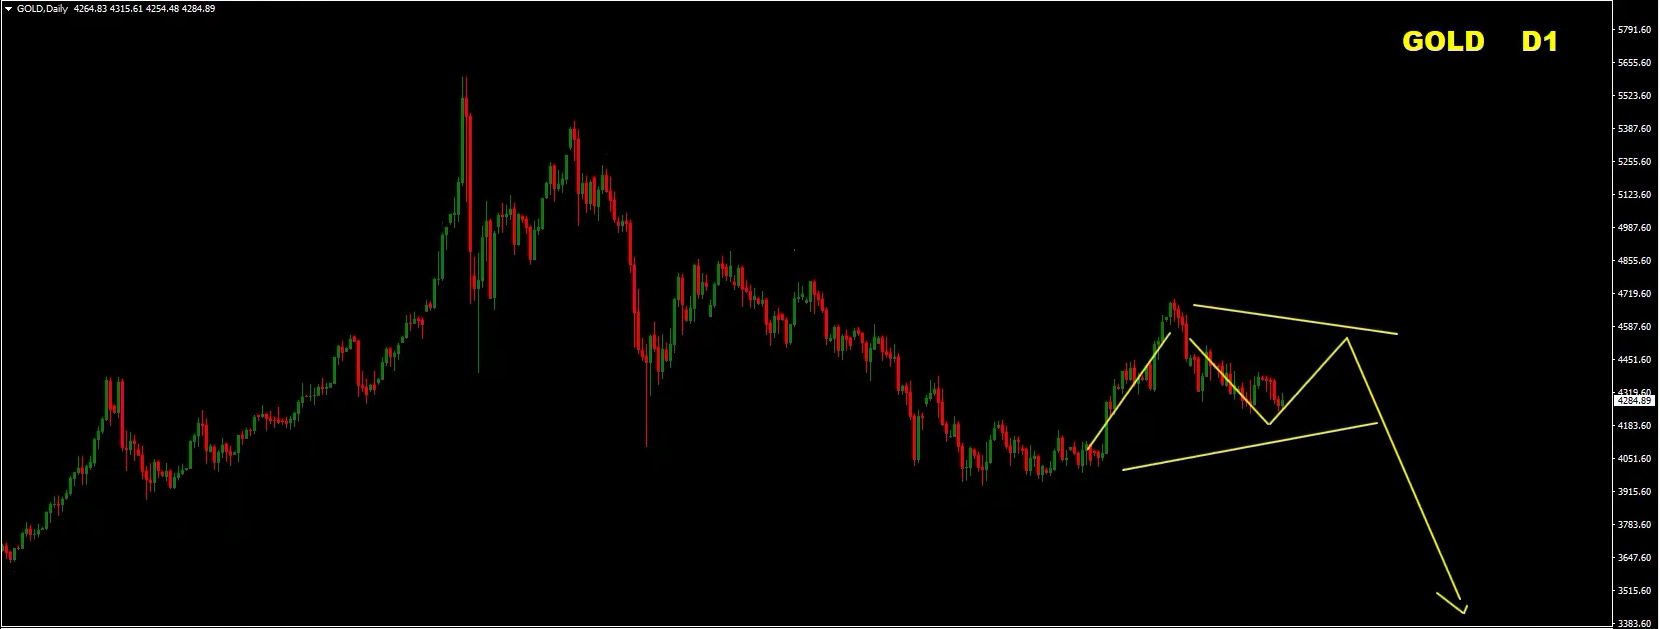
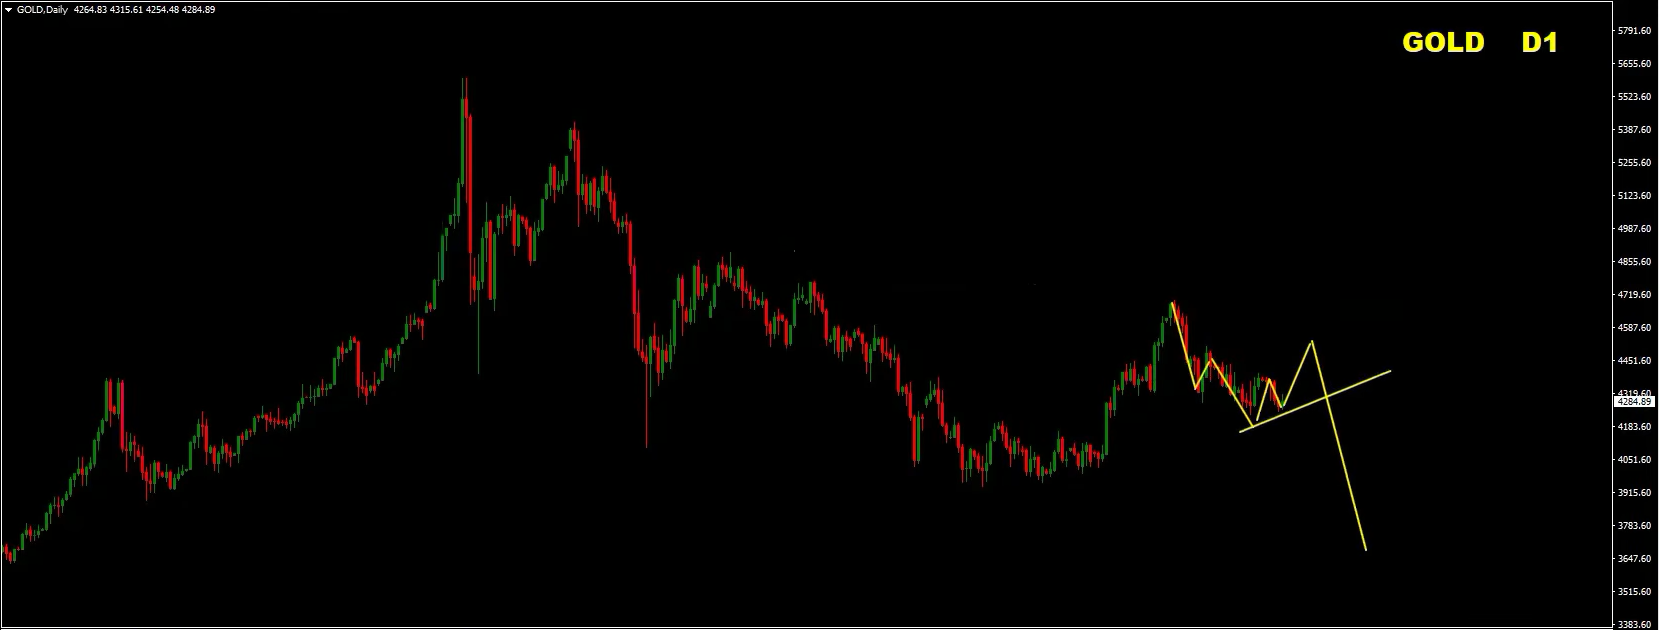
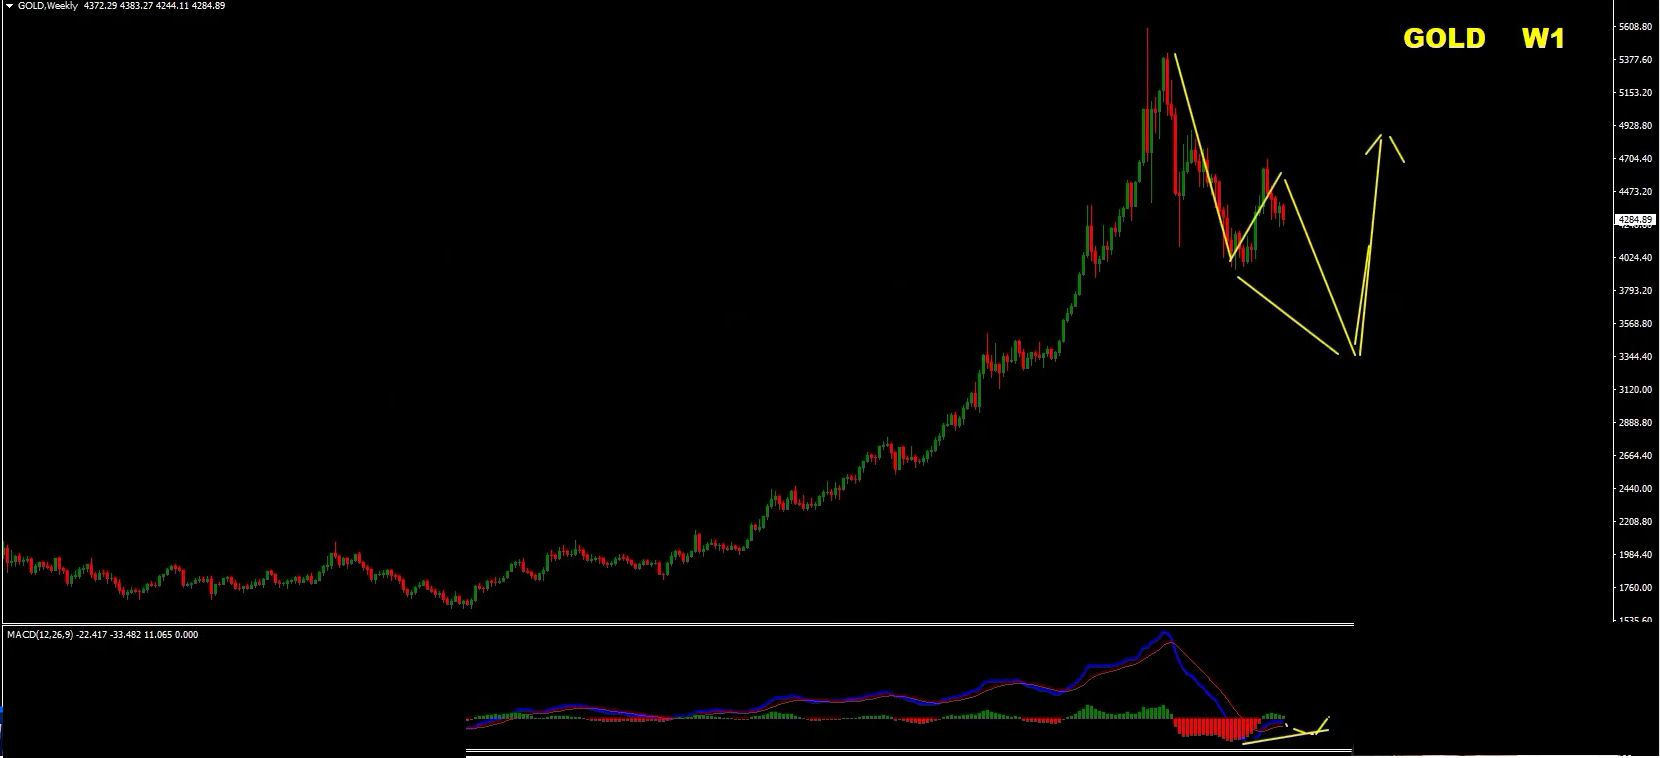
Gold remains one of the most interesting markets to watch.
The overall technical view has not changed significantly from the previous week.
Price has spent much of the recent period moving around the same levels without producing a decisive breakout.
This creates several possible scenarios.
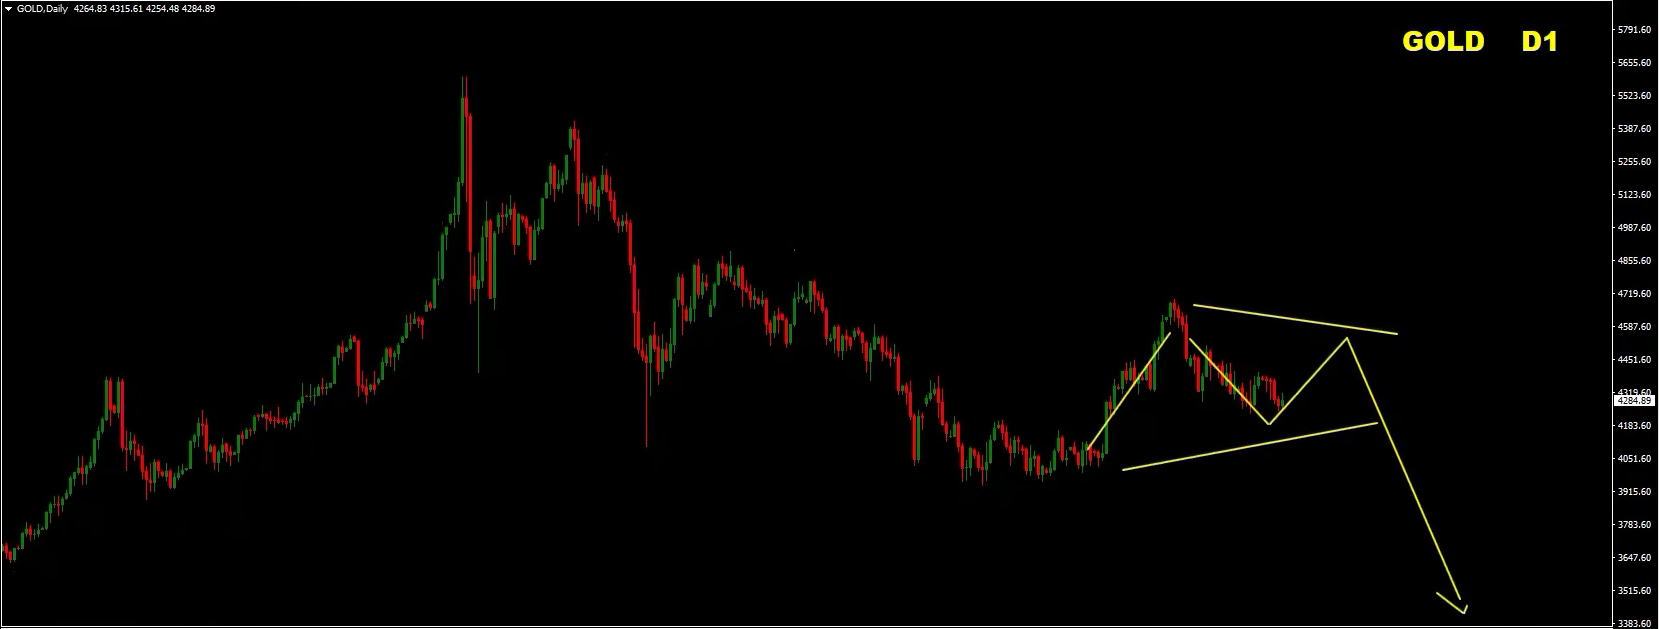
One possibility is that Gold completes an ABCD-type structure and returns toward the important support zone.
Another possibility is that price develops a larger consolidation or range before the next major directional move.
There is also a scenario where the previous peak has already completed.
If the major resistance continues to hold, Gold could potentially develop a corrective structure consisting of multiple waves before eventually breaking lower.
The important point is that the bearish move may not yet be complete.
The preferred approach is to wait for the structure to develop.
A potential sequence could look like:
Resistance → corrective waves → divergence → reversal opportunity
Eventually, if a strong bullish divergence develops around an important support zone, that could provide a signal that the bearish correction is losing momentum.
Until then, the short-term approach remains:
Sell the rallies.
However, traders should be particularly careful with Gold because it can experience very sharp moves around geopolitical developments and major economic events.
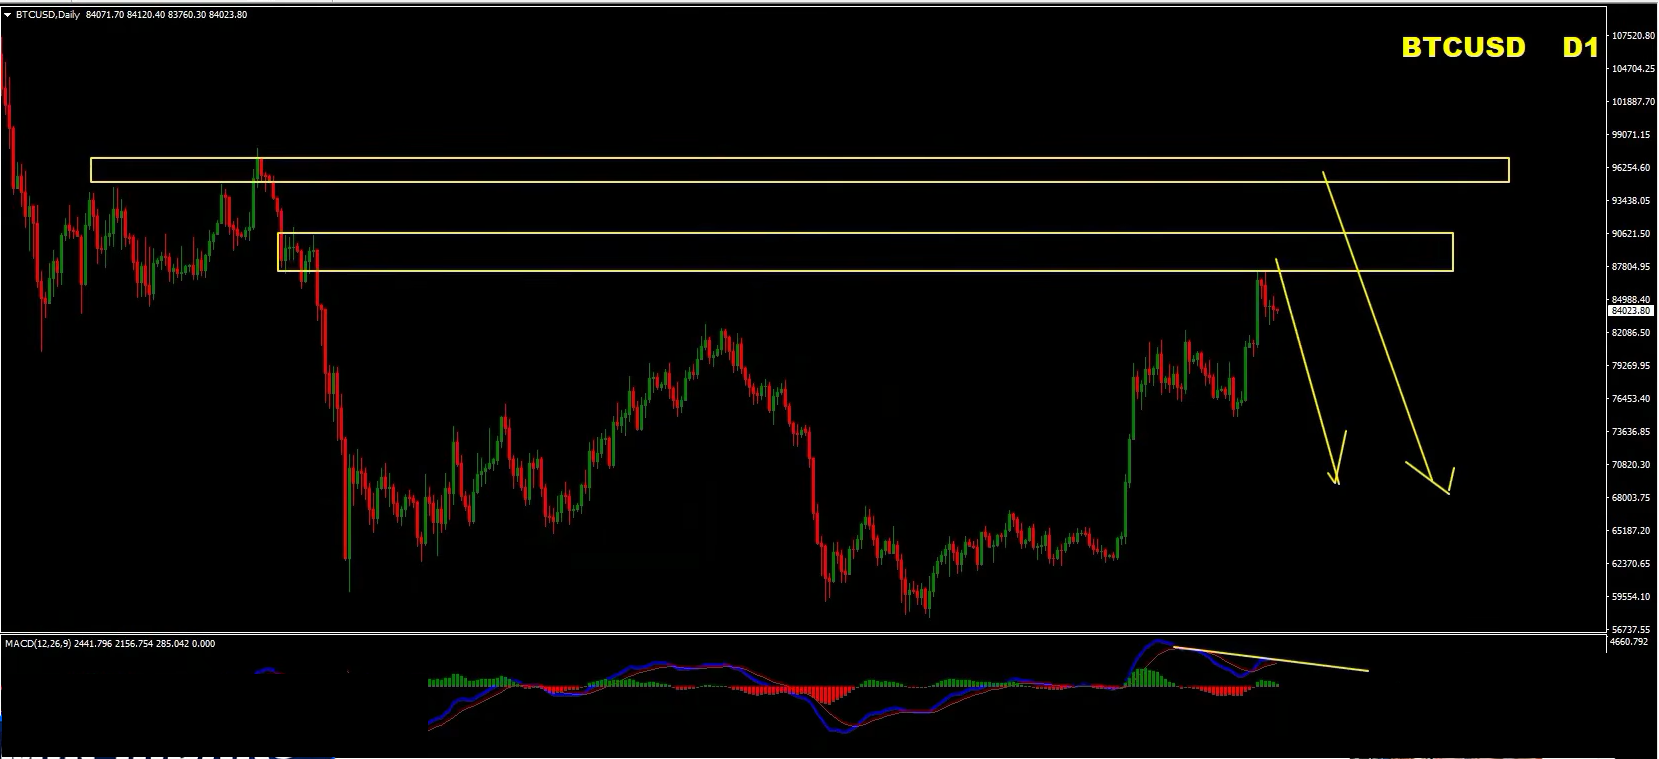
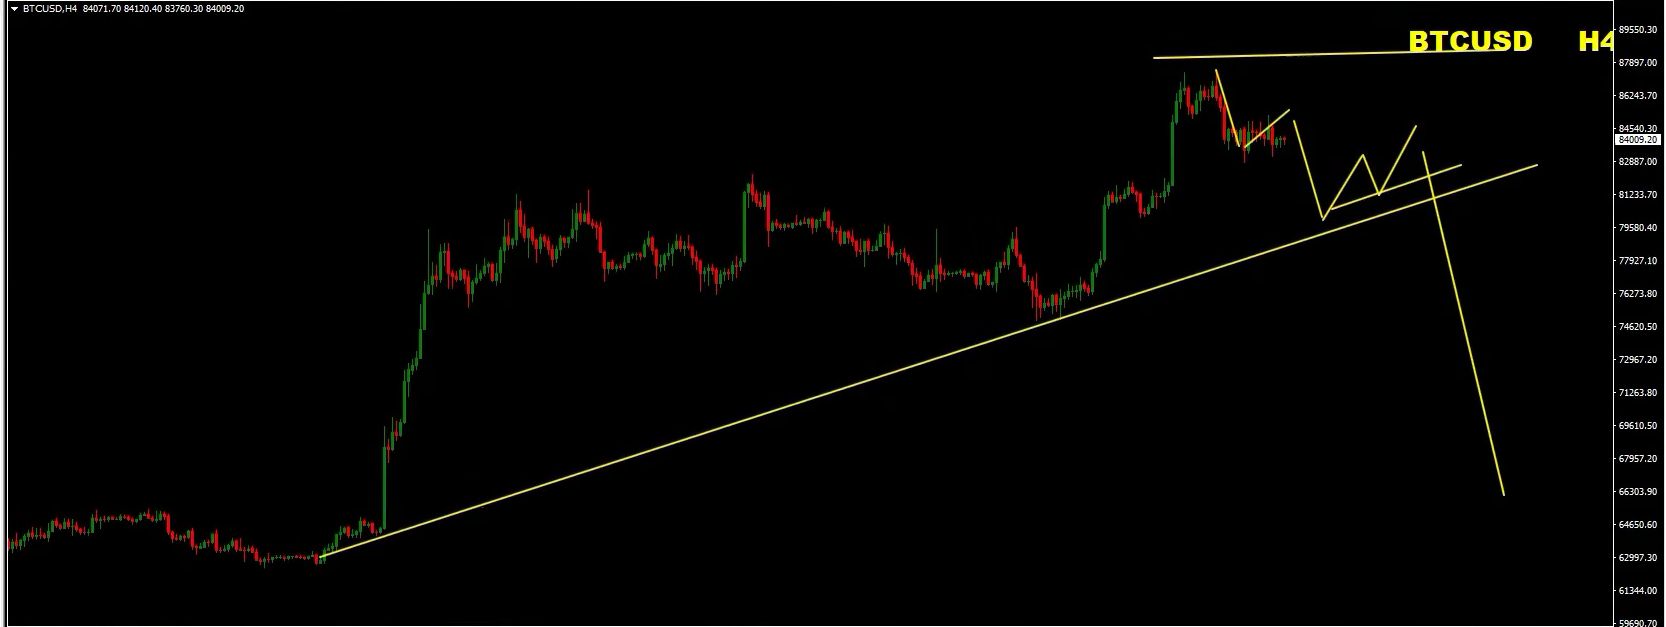
Bitcoin is approaching an important technical area.
The market is currently retesting a previous consolidation and supply zone.
This makes the current region particularly important for the coming weeks.
There is another major area closer to:
$95,000–$100,000
Both zones could potentially act as resistance if Bitcoin fails to break and hold above them.
Bearish divergence is beginning to develop.
This means traders should watch for confirmation rather than automatically assuming that the market must fall.
The key question is whether Bitcoin produces a bearish reversal signal around the resistance zones.
If it does, a deeper correction could develop.
Potential downside areas include:
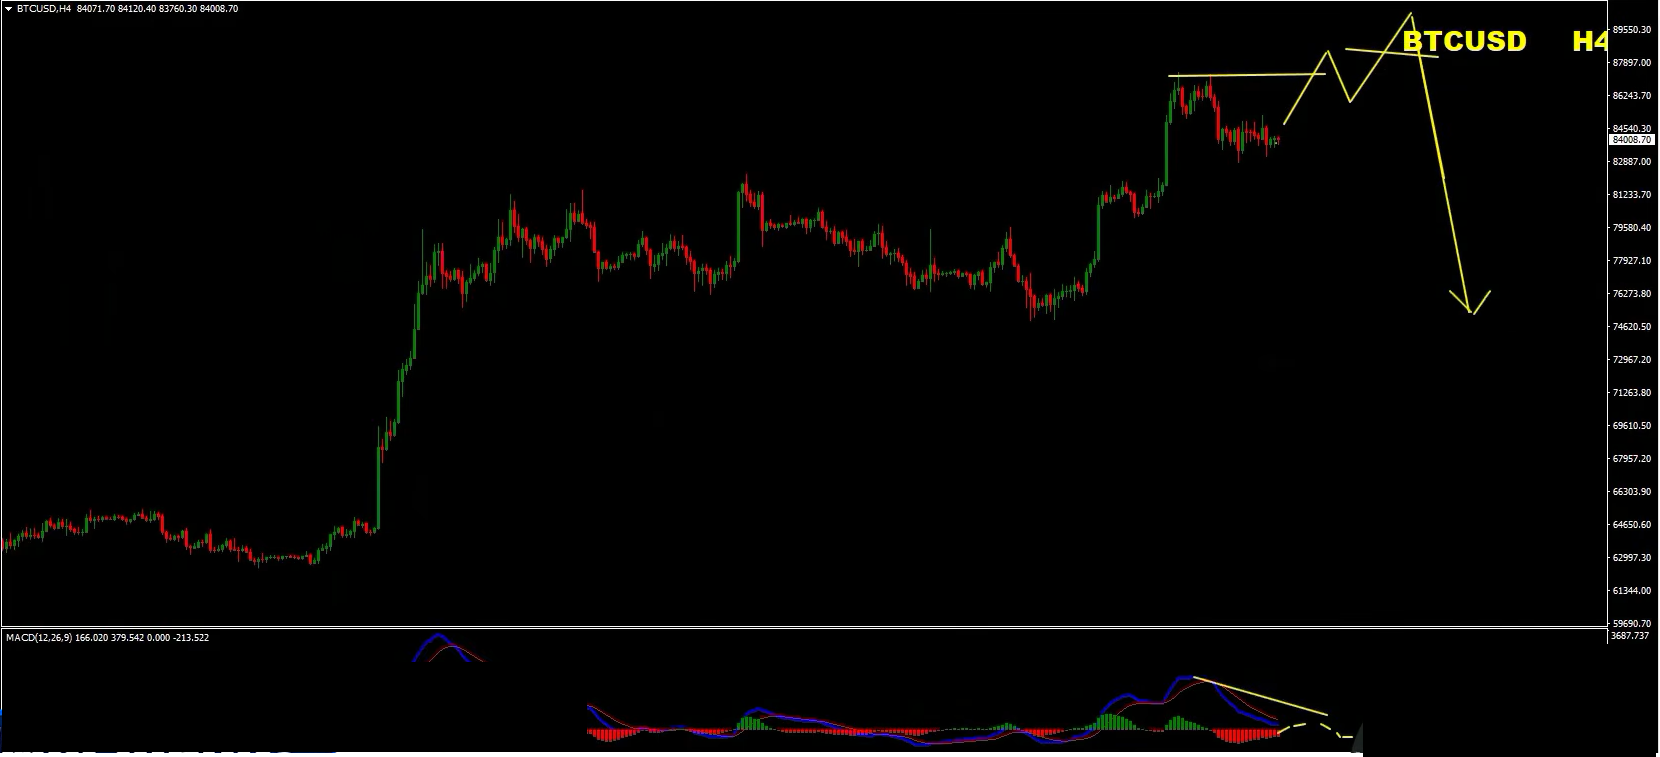
There are two main scenarios to monitor.
The ideal bearish setup would be a false breakout above resistance.
For example:
Higher high on price + lower high on MACD = bearish divergence
If price then returns below the breakout area, this could provide confirmation of a potential bearish reversal.
Bitcoin could alternatively begin forming lower highs and lower lows on the 4-hour chart.
A pullback followed by another downside break could provide a bearish continuation setup.
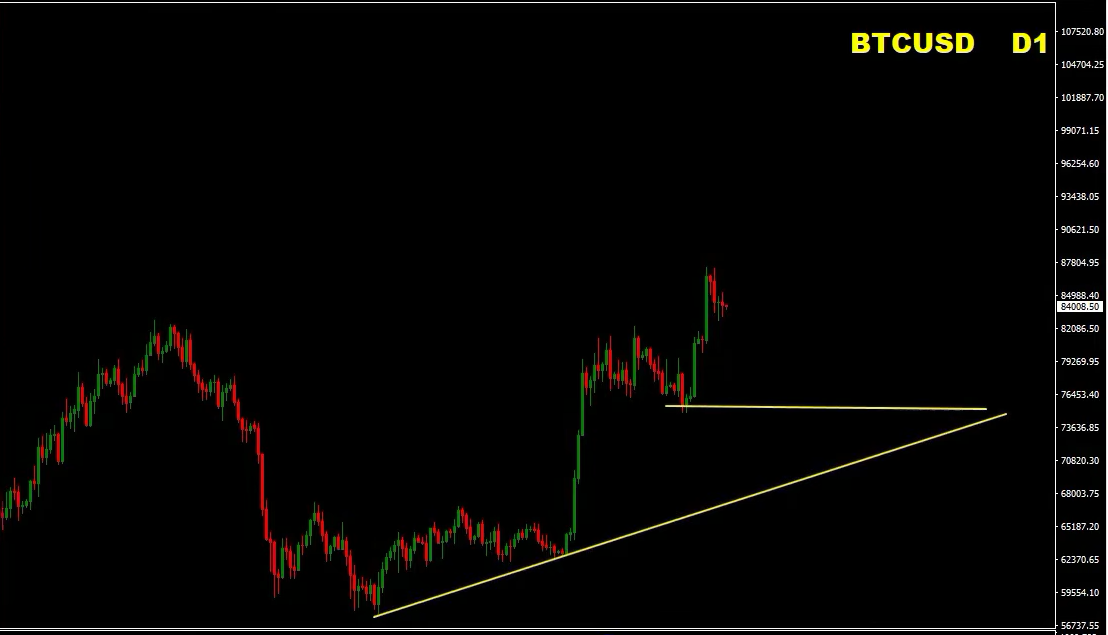
A break of the rising trendline would make the structure even more significant.
As long as the major resistance zones continue to hold, the focus remains on potential short opportunities after confirmation.
The next several weeks could therefore be important for Bitcoin as price tests these major technical areas.
Here is a simplified overview of the current technical outlook:
| Market | Key Technical Structure | Important Areas | Short-Term Focus |
|---|---|---|---|
| EURUSD | Lower highs / lower lows | 1.13, 1.12, 1.11, 1.10 | Sell rallies |
| GBPUSD | Bearish correction | 1.30, 1.29, 1.20 | Sell rallies |
| USDJPY | Bearish below resistance | 153, 152, 150 | Sell below resistance |
| Gold | Bearish correction / resistance | Major resistance & support zones | Sell rallies |
| Bitcoin | Supply + bearish divergence | $95K–$100K, $77K | Watch for reversal |
These levels are technical reference points from the current market structure and can change as new price action develops.
Technical analysis provides the framework, but traders should not ignore the fundamental environment.
The current market remains sensitive to geopolitical developments, particularly developments involving:
Geopolitical headlines can produce sudden volatility in currencies, Gold and Bitcoin.
For that reason, traders should always check the economic calendar and major news releases before entering a position.
A technically perfect setup can still fail if unexpected news produces a sharp market reaction.
The week ahead could bring significant volatility across Forex, Gold and cryptocurrency markets.
EURUSD and GBPUSD continue to show bearish structures, while USDJPY remains under pressure as long as its key resistance zone holds.
Gold continues to show the possibility of a larger corrective move, while Bitcoin is approaching important supply areas where bearish reversal setups could develop.
The technical message remains clear:
Sell the rallies.
But remember that the market does not move in a straight line.
Pullbacks, false breakouts and temporary reversals are part of the process.
The goal is not to predict every move.
The goal is to identify important technical areas, wait for confirmation and manage risk properly.
As always, trade with a plan, protect your capital and never risk more than you can afford to lose.
If you enjoyed this weekly Forex forecast, make sure to follow Home Trader Club for more Forex analysis, trading education, market forecasts and real-time trading opportunities.
You can also explore the Home Trader Club courses, real-time education and trading tools available through our official channels.
Want to access the tools, systems, and real-time education we use daily?
With AvaTrade Broker’s support, you can now enjoy up to one full year of access to the Home Trader Club — including:
All professional trading systems
Access to our new project, the Home Trader Club trade copier, where our traders trade and you can copy.
Real-time trade ideas and setups
Full access to our course library and trading marketplace
Wishing you a profitable week ahead!
Vladimir Ribakov
Internationally Certified Financial Technician
Home Trader Club
Risk Disclaimer
Trading Forex, CFDs, cryptocurrencies, Gold and other financial instruments involves substantial risk and may not be suitable for every trader. Technical analysis and market forecasts represent opinions and scenarios, not guarantees of future performance. Always conduct your own analysis, use appropriate risk management and never trade with money you cannot afford to lose.
Welcome back to our weekly Forex forecast at Home Trader Club. This week, we are…
GDP growth is one of the most important indicators of economic health. But does stronger…
When it comes to fundamental Forex analysis, few institutions matter as much as the Federal…
Interest rates are one of the most important fundamental forces in the Forex market. But…
The latest U.S. employment report has delivered a significant warning for the market. With only…
The Forex market does not always offer clear trading opportunities. Sometimes, price moves sharply in…