Hi Traders! Arvinth here from the Home Trader Club team. The weekly summary and, review of May 10th 2024 is here. It is now time to recap and summarize the trade setups that we had during this week. Below you will find a short explanation of all the trade setups we had this week and how it has currently developed now.
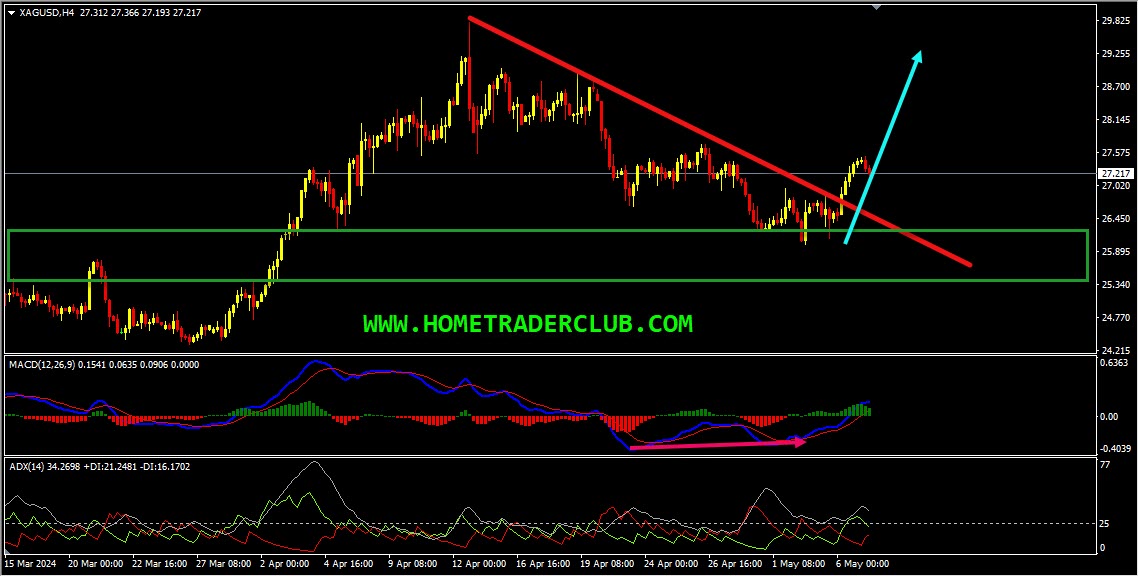
Silver – My idea here was “On the H4 chart, the price which was moving lower created a bullish divergence that has formed between the first low that has formed at 26.658 and the second low that has formed at 26.007 based on the MACD indicator. The price then moved higher and has broken above the most recent downtrend line, we may consider these as evidences of bullish pressure. In addition to this, the ADX indicator gave a bullish signal here as well at the cross of +DI (green line) versus -DI (red line) and the main signal line (silver line) reads value over 25, we may consider this as yet another evidence of bullish pressure. So based on all this, until the strong support zone shown in the image below (marked in green) holds my short-term view remains bullish here and I expect the price to move higher further”.
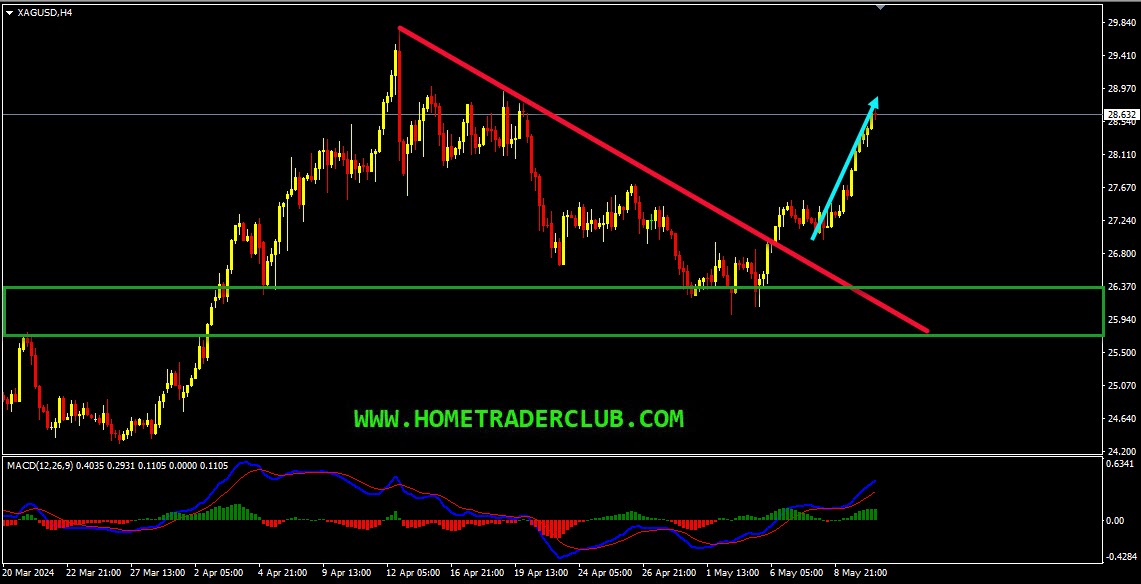
Current Scenario – In Silver, after the downtrend line breakout, I was expecting the price to move higher further until the strong support zone holds. The price action followed my analysis exactly as I expected it to here. The price moved higher further and has delivered a nice move to the upside so far!
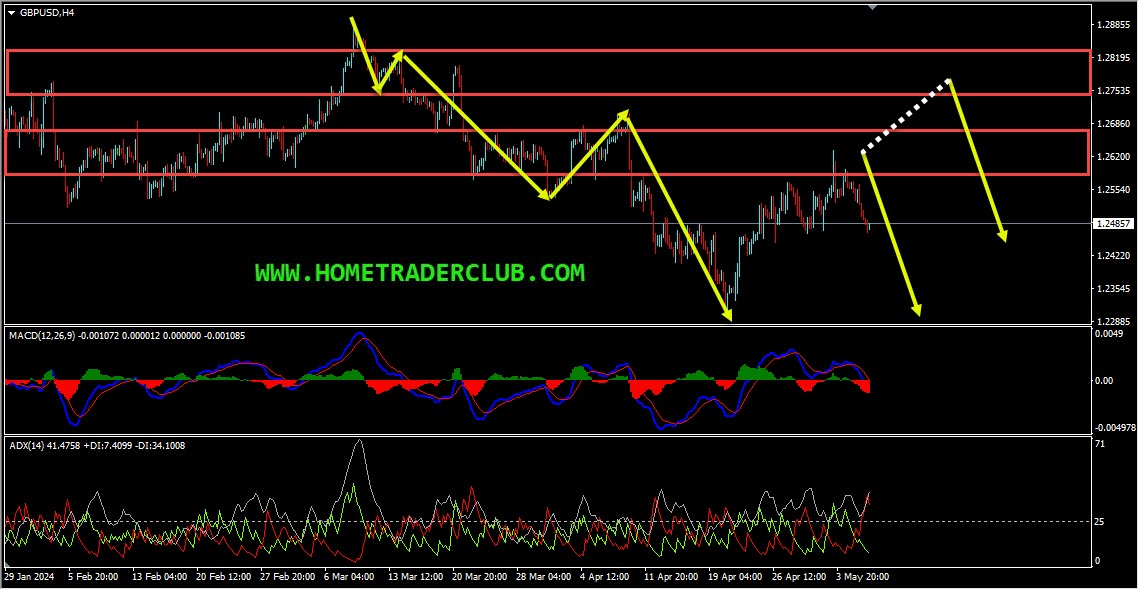
GBPUSD – My idea here was “On the H4 chart, the price which is moving lower has created a bearish trend pattern in the form of three lower highs, lower lows which we may consider as evidence of bearish pressure. Generally, after a bearish trend pattern, we may expect corrections and then further continuation lower. Currently, it looks like a correction is happening. In addition to this, the ADX indicator gave a bearish signal here at the cross of -DI (red line) versus +DI (green line) and the main signal line (silver line) reads value over 25 which we may consider as yet another evidence of bearish pressure. Also, we had two strong support zones that has formed and the price which was moving lower has broken below these zones and is holding below them, we may consider this as yet another evidence of bearish pressure. Currently, these strong support zones are acting as strong resistance zones for us. Until these two strong resistance zones (marked in red) shown in the image below hold my short term view remains bearish here and I expect the price to move lower further”.
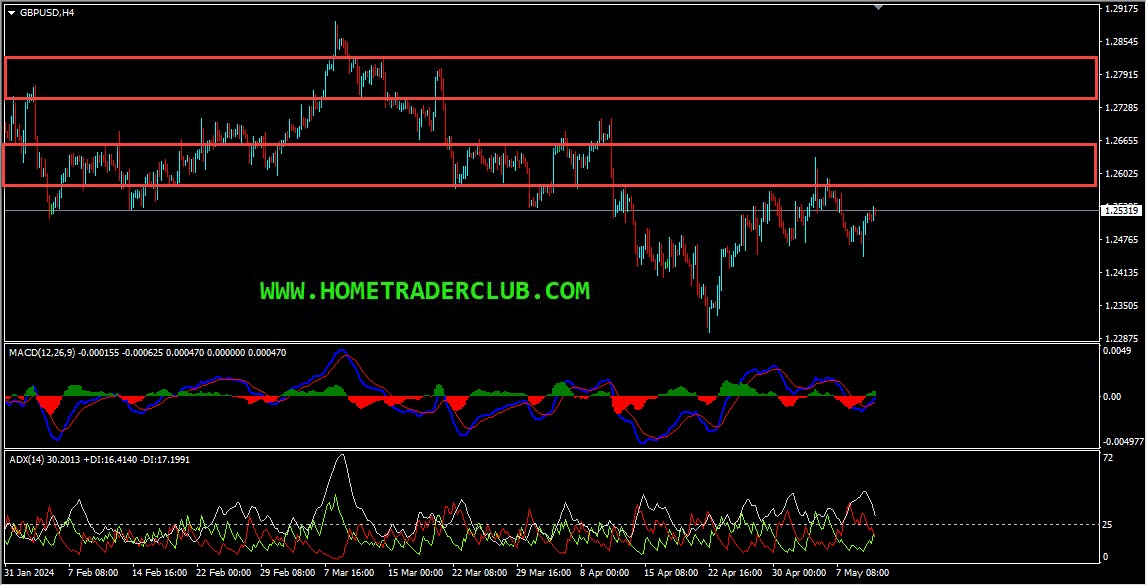
Current Scenario – In GBPUSD, the price action is following the bearish expectations so far. My plan didn’t change here, that is, I expect the price to move lower further in the short term after pullbacks until the two strong resistance zones (marked in red) shown in the image below holds.
EURCHF – My idea here was “On the H1 chart, the price which is moving lower has created a bearish trend pattern in the form of three lower highs, lower lows which we may consider as evidence of bearish pressure. Generally, after a bearish trend pattern, we may expect corrections and then further continuation lower. Currently, it looks like a correction is happening. In addition to this, the ADX indicator gave a bearish signal here at the cross of -DI (red line) versus +DI (green line) and the main signal line (silver line) reads value over 25 which we may consider as yet another evidence of bearish pressure. Also, we had two strong support zones that has formed and the price which was moving lower has broken below these zones and is holding below them, we may consider this as yet another evidence of bearish pressure. Currently, these strong support zones are acting as strong resistance zones for us. Until these two strong resistance zones (marked in red) shown in the image below hold my short term view remains bearish here and I expect the price to move lower further”.
Current Scenario – My plan still remains the same in EURCHF, that is until the two strong resistance zones hold my short term view remains bearish here and I expect the price to move lower further after pullbacks.
For similar trade ideas and much more I invite you to join the Home Trader Club and improve your trading with us.
You will also find a pretty extensive database of educational materials here in the blog – just use the search or check out the Forex Education section above.
If you have any further questions, don’t hesitate to drop a comment below!
Happy Trading!
Arvinth Akash
Home Trader Club Team.
Hi Traders! Arvinth here from the Home Trader Club team. The weekly summary and, review of April…
Stocks and bonds fell as oil surged anew, with President Donald Trump dashing optimism that the war in…
Hi Traders! GBPCAD short term forecast and technical analysis is here. We do our analysis…
Hi Traders! AUDJPY short term forecast and technical analysis is here. We do our analysis…
Hi Traders! EURJPY short term forecast update and follow up is here. On February 3rd,…
Hi Traders! NASDAQ short term forecast and technical analysis is here. We do our analysis…