Hi Traders! Arvinth here from the Home Trader Club team. The weekly summary and, review of March 29th 2024 is here. It is now time to recap and summarize the trade setups that we had during this week. Below you will find a short explanation of all the trade setups we had this week and how it has currently developed now.
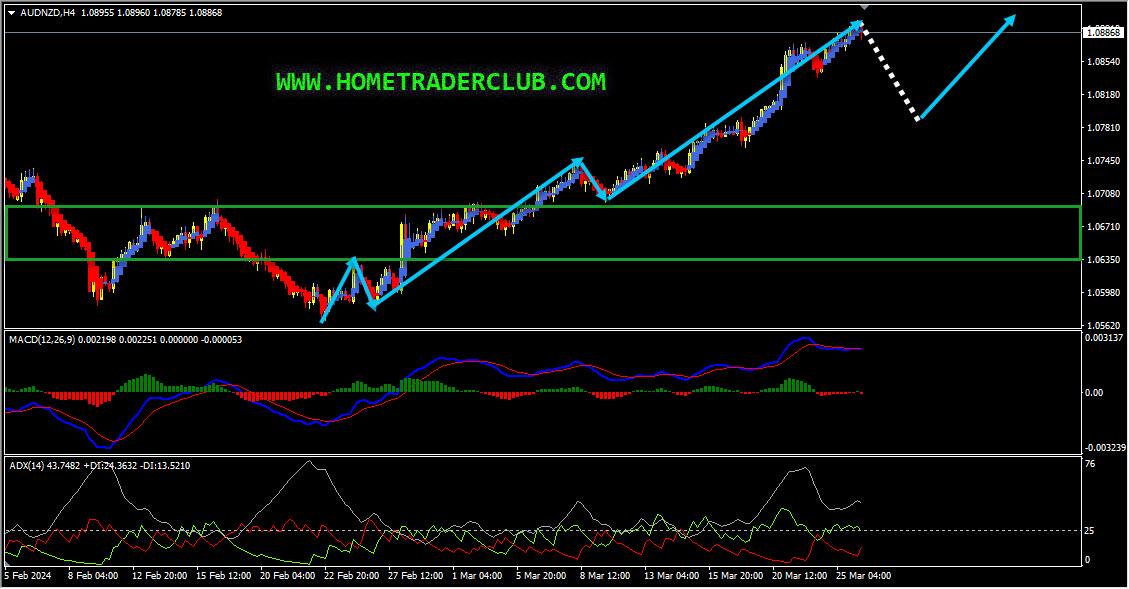
AUDNZD – My idea here was “On the H4 chart, based on the Heikin Ashi candles we can see that currently, we have strong bullish bodies in upward moving market conditions so it basically reflects a bullish environment. Also, the price which is moving higher has created a bullish trend pattern in the form of three higher highs, higher lows, we may consider this as another evidence of bullish pressure. Generally, after a bullish trend pattern, we may expect corrections and then potential continuation higher. In addition to this, the ADX indicator gave a bullish signal here at the cross of +DI (green line) versus -DI (red line) and the main signal line (silver line) reads value over 25, we may consider this as yet another evidence of bullish pressure. Also we had a strong resistance zone that have formed and the price which is moving higher has broken above this zone and is holding above it. After the breakout, this strong resistance zone is acting as a strong support zone for us. So everything looks good here for the bulls and until the strong support zone (marked in green) shown in the image below holds my short-term view remains bullish here and I expect the price to move higher further after pullbacks”.
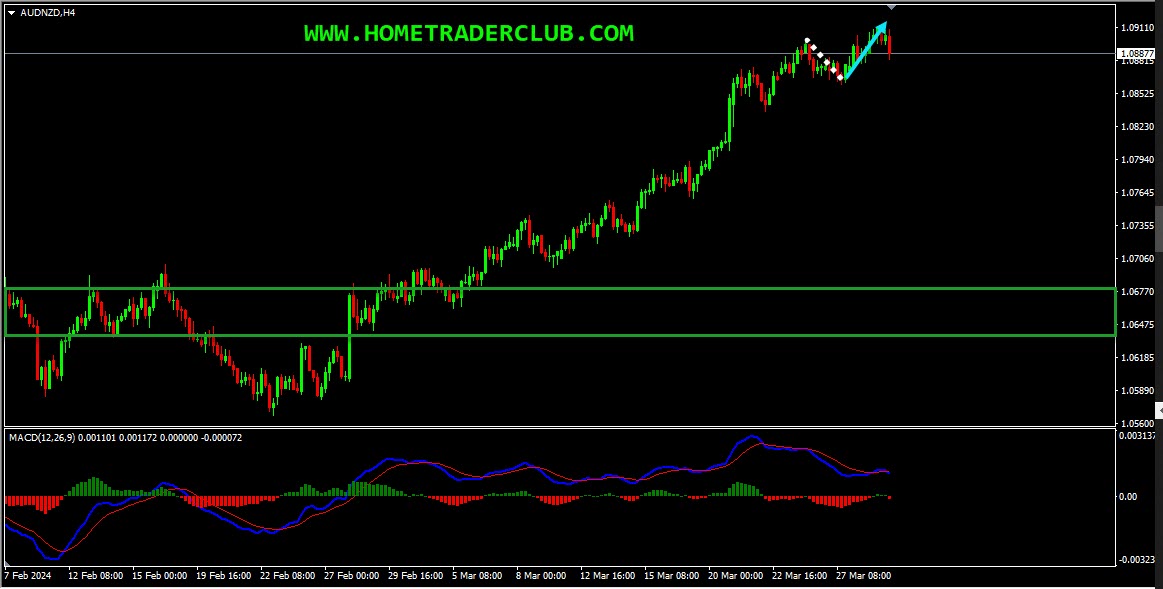
Current Scenario – In AUDNZD, after the bullish trend pattern, I was expecting the price to move higher further after pullbacks until the strong support zone holds. The price action followed my analysis exactly as I expected it to here. We had a small pullback and then the price moved higher further and has delivered a nice move to the upside so far.
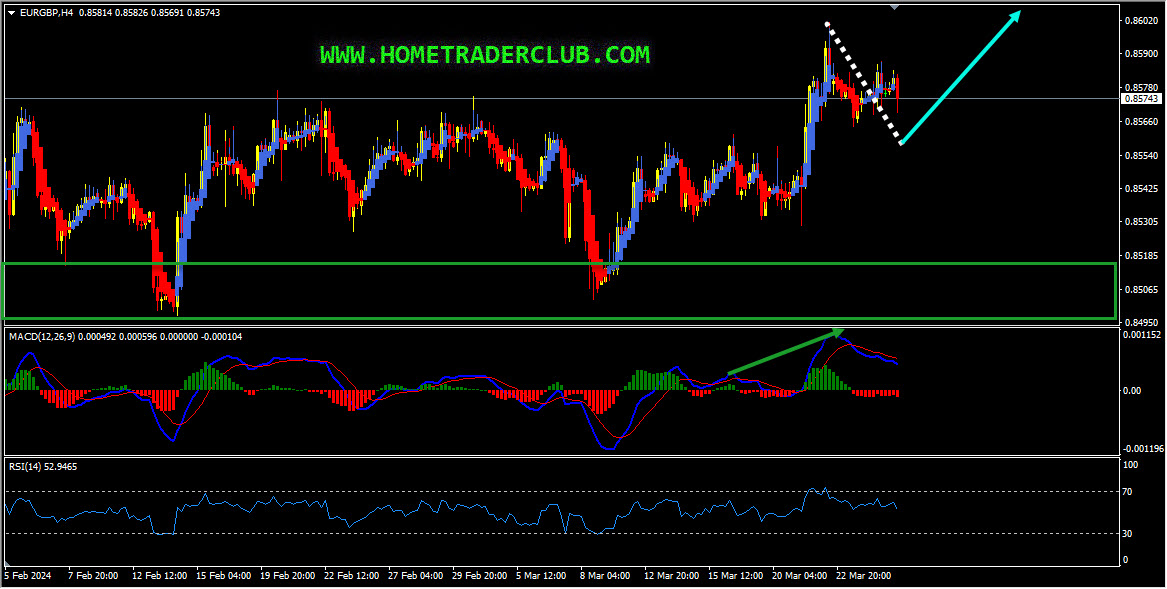
EURGBP – My idea here was “On the H4 chart, we have a strong bullish momentum and based on the Heikin Ashi candles we can see that currently, we have strong bullish bodies in upward-moving market conditions so it basically reflects a bullish environment. In addition to this, we could see that the price which is moving higher has created higher highs based on the MACD indicator, which is a sign of gaining momentum towards the bullish side. In addition to this, currently there are no signs opposing this bullish view here as well. So everything looks good here for the bulls and until the strong support zone (marked in green) shown in the image below holds my short-term view remains bullish here and I expect the price to move higher further after pullbacks”.
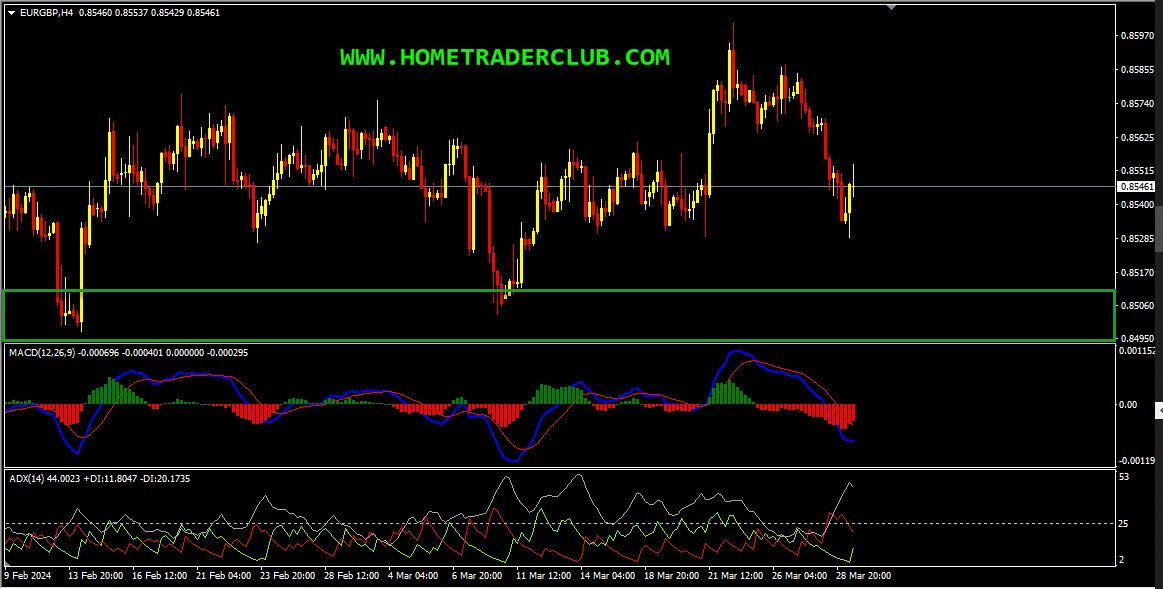
Current Scenario – In EURGBP, based on the above-mentioned analysis my short term view was bullish until the strong support zone holds and I was expecting the price to move higher further after pullbacks. The price action is following the bullish expectations so far, my short term bullish view still remains the same here.
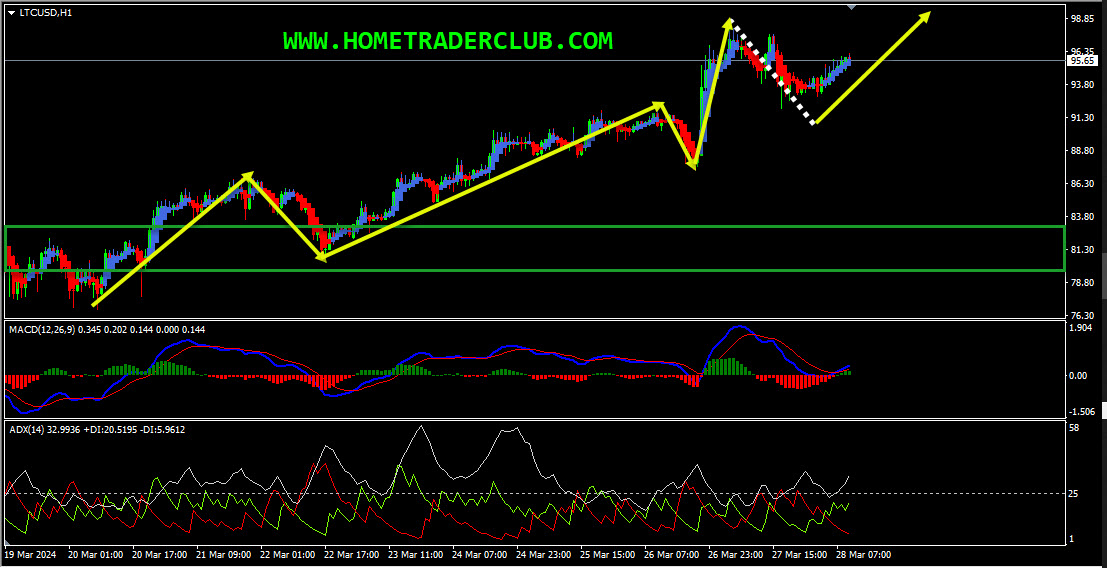
Litecoin – My idea here was “On the H1 chart, based on the Heikin Ashi candles we can see that currently, we have strong bullish bodies in upward moving market conditions so it basically reflects a bullish environment. Also, the price which is moving higher has created a bullish trend pattern in the form of three higher highs, higher lows, we may consider this as another evidence of bullish pressure. Generally, after a bullish trend pattern, we may expect corrections and then potential continuation higher. In addition to this, the ADX indicator gave a bullish signal here at the cross of +DI (green line) versus -DI (red line) and the main signal line (silver line) reads value over 25, we may consider this as yet another evidence of bullish pressure. Also we had a strong resistance zone that have formed and the price which is moving higher has broken above this zone and is holding above it. After the breakout, this strong resistance zone is acting as a strong support zone for us. So everything looks good here for the bulls and until the strong support zone (marked in green) shown in the image below holds my short-term view remains bullish here and I expect the price to move higher further after pullbacks”.
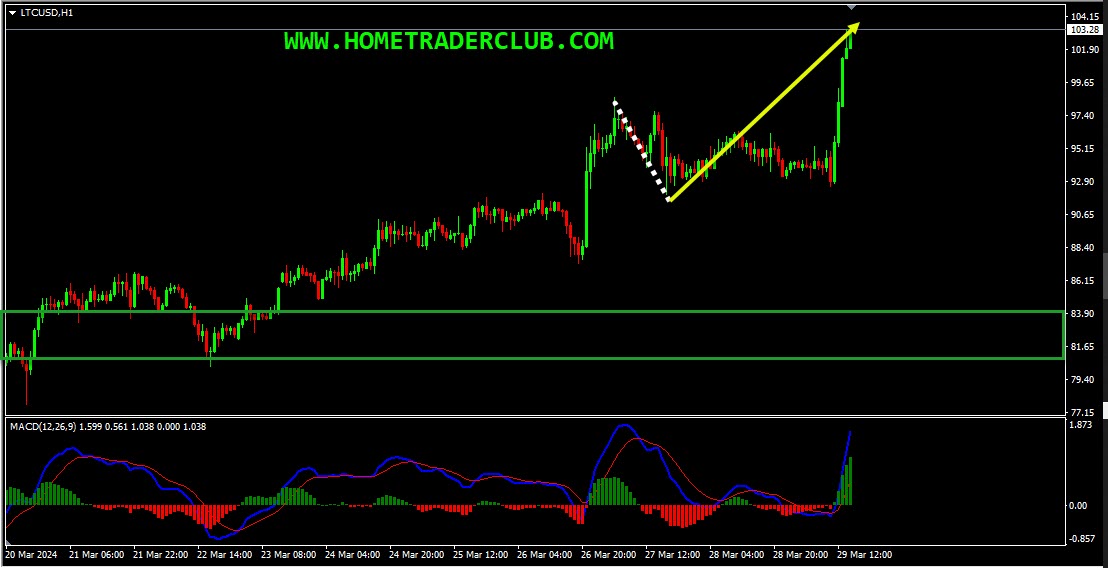
Current Scenario – In Litecoin, I was expecting the price to move higher further after pullbacks until the strong support zone holds. The price action followed my analysis exactly as I expected it to here. The pullback that I was looking for happened and then the price moved higher further and has delivered an excellent move to the upside so far!
For similar trade ideas and much more I invite you to join the Home Trader Club and improve your trading with us.
You will also find a pretty extensive database of educational materials here in the blog – just use the search or check out the Forex Education section above.
If you have any further questions, don’t hesitate to drop a comment below!
Happy Trading!
Arvinth Akash
Home Trader Club Team.
Hi Traders! Ethereum short term forecast follow-up and update is here. On May 26th, 2026…
Hi Traders! GBPAUD short term forecast and technical analysis is here. We do our analysis…
Hi Traders! USDCHF short term forecast update and follow up is here. On May 20th,…
Hi Traders! CADCHF short term forecast and technical analysis is here. We do our analysis…
The dollar was broadly steady on Monday as cautious investors watched out for signals on…
Hi Traders! Arvinth here from the Home Trader Club team. The weekly summary and, review of July…