Hi Traders! Arvinth here from the Home Trader Club team. The weekly summary and, review of August 9th 2024 is here. It is now time to recap and summarize the trade setups that we had during this week. Below you will find a short explanation of all the trade setups we had this week and how it has currently developed now.
As an Internationally Certified Financial Technician (CFTe, IFTA) and former private capital hedge fund trader, I have successfully mentored numerous students who are now thriving in the trading world. Students who learned with me, are now full-time traders, work in the trading industry, run their own capital firms or are fully funded traders by private companies, develop automated trading solutions and manage others’ capitals. I am a very proud mentor and I am proud of the success stories I’ve helped create, and for a limited time, I’m offering my mentorship program for free through a partnership with Eight Cap broker. Join Eight Cap, become an active trader, and choose the offer that suits you best –
For more details, visit: Home Trader Club Mentorship Program
I’m excited to work with you and help you reach your desired level of success!
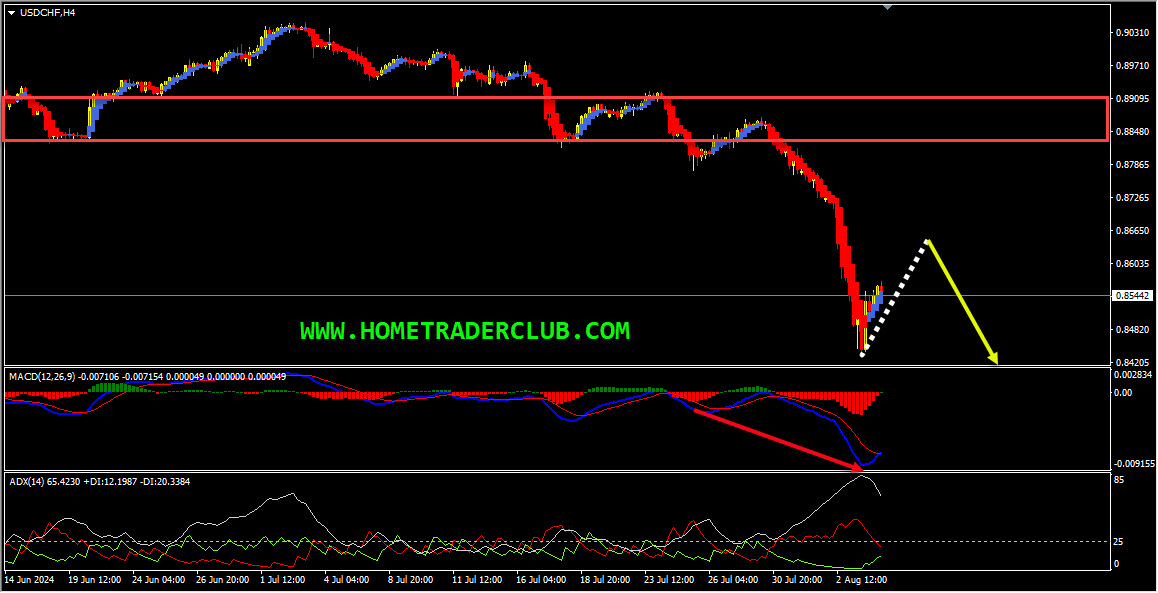
USDCHF – My idea here was “On the H4 chart, currently, we have a strong bearish momentum and the price which is moving lower has broken below a strong support zone and is holding below it, we may consider this as evidence of bearish pressure. After the breakout, this strong support zone is acting as a strong resistance zone for us. Also, the price which is moving lower has created lower lows based on the MACD indicator, which is another sign of gaining momentum toward the bearish side. Currently it looks like a correction is happening. Also, based on the Heikin Ashi candles we can see that currently, we have strong bearish bodies in downward moving market conditions so it basically reflects a bearish environment. In addition to this, the ADX indicator gave a bearish signal here at the cross of -DI (red line) versus +DI (green line) and the main signal line (silver line) reads value over 25 which we may consider as yet another evidence of bearish pressure. So the bottom line here is that, everything looks good here for the bears and I expect the price to move lower further in the short term after pullbacks until the strong resistance zone (marked in red) shown in the image below holds”.
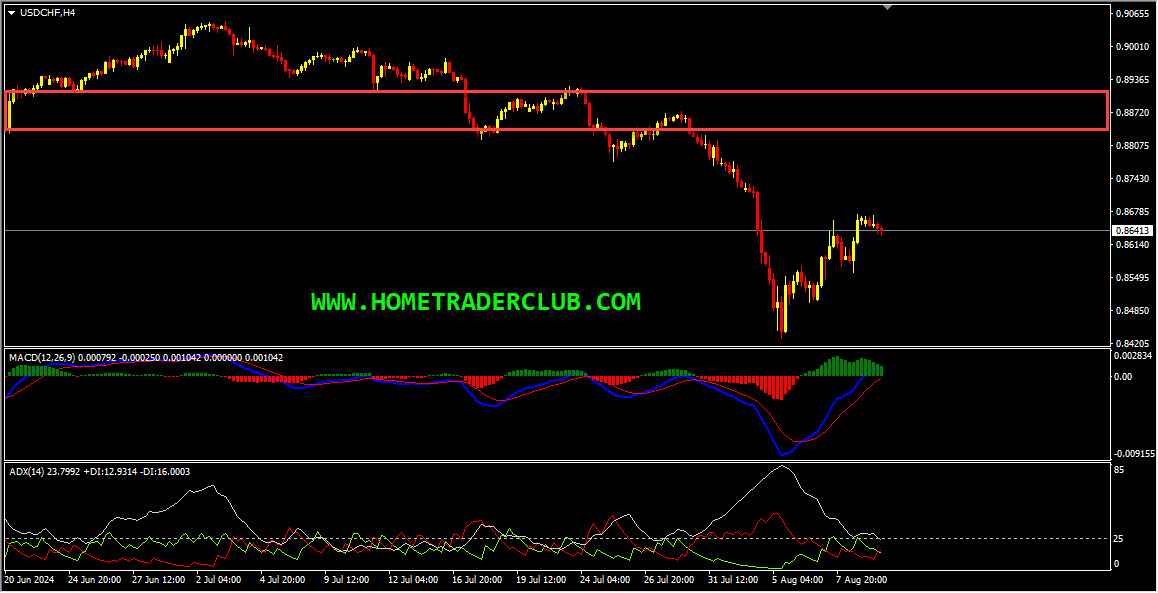
Current Scenario -In USDCHF, until the strong resistance zone holds I was expecting short term bearish moves to happen after pullbacks. The price action is following the bearish expectations so far, my plan still remains the same here.
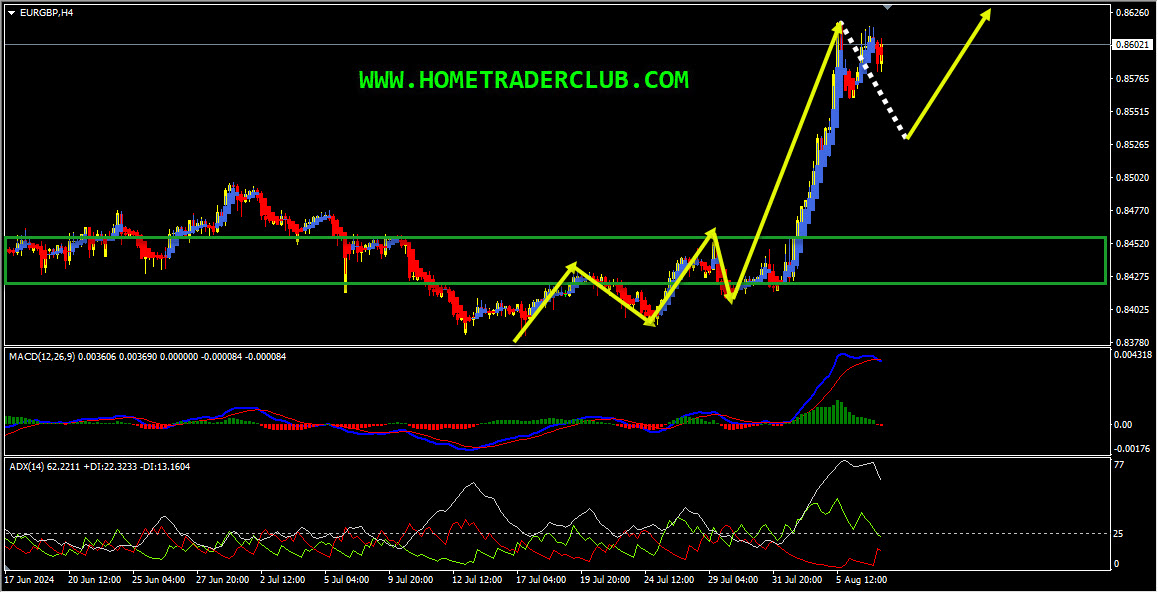
EURGBP– My idea here was “On the H4 chart, based on the Heikin Ashi candles we can see that currently, we have strong bullish bodies in upward moving market conditions so it basically reflects a bullish environment. Also, the price which is moving higher has created a bullish trend pattern in the form of three higher highs, higher lows, we may consider this as another evidence of bullish pressure. Generally, after a bullish trend pattern, we may expect corrections and then potential continuation higher. Currently, it looks like a correction is happening. In addition to this, the ADX indicator gave a bullish signal here at the cross of +DI (green line) versus -DI (red line) and the main signal line (silver line) reads value over 25, we may consider this as yet another evidence of bullish pressure. Also we had a strong resistance zone that have formed and the price which is moving higher has broken above this zone and is holding above it. After the breakout, this strong resistance zone is acting as a strong support zone for us. So everything looks good here for the bulls and until the strong support zone (marked in green) shown in the image below holds my short-term view remains bullish here and I expect the price to move higher further after pullbacks”.
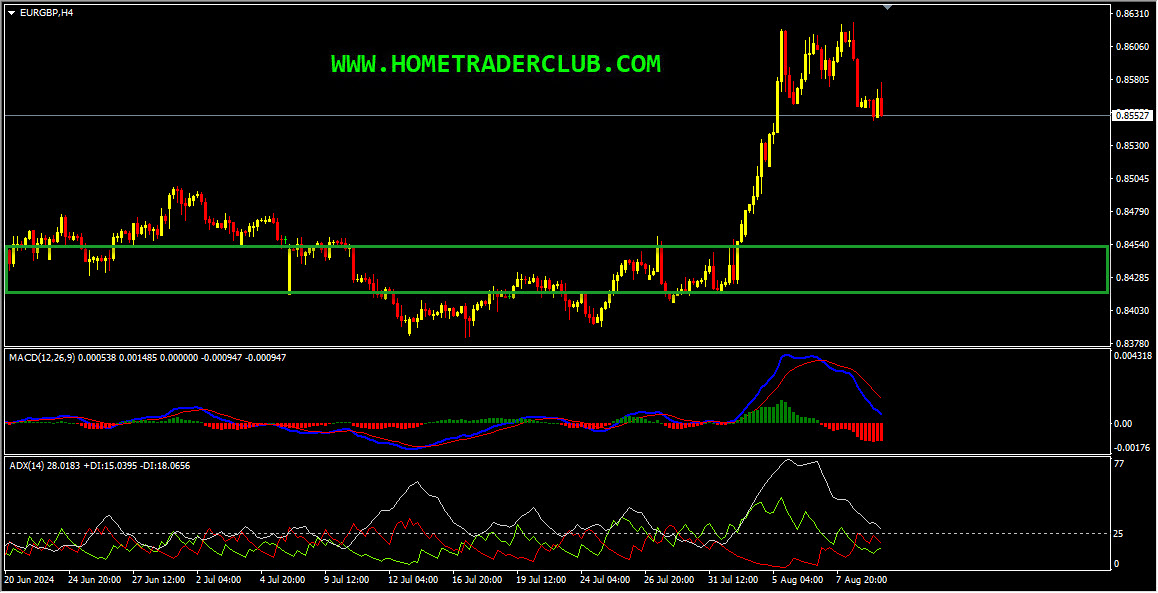
Current Scenario – In EURGBP, based on the above-mentioned analysis my short term view was bullish until the strong support zone holds and I was expecting the price to move higher further after pullbacks. Currently it looks like a pullback is happening, my short term bullish view still remains the same here.
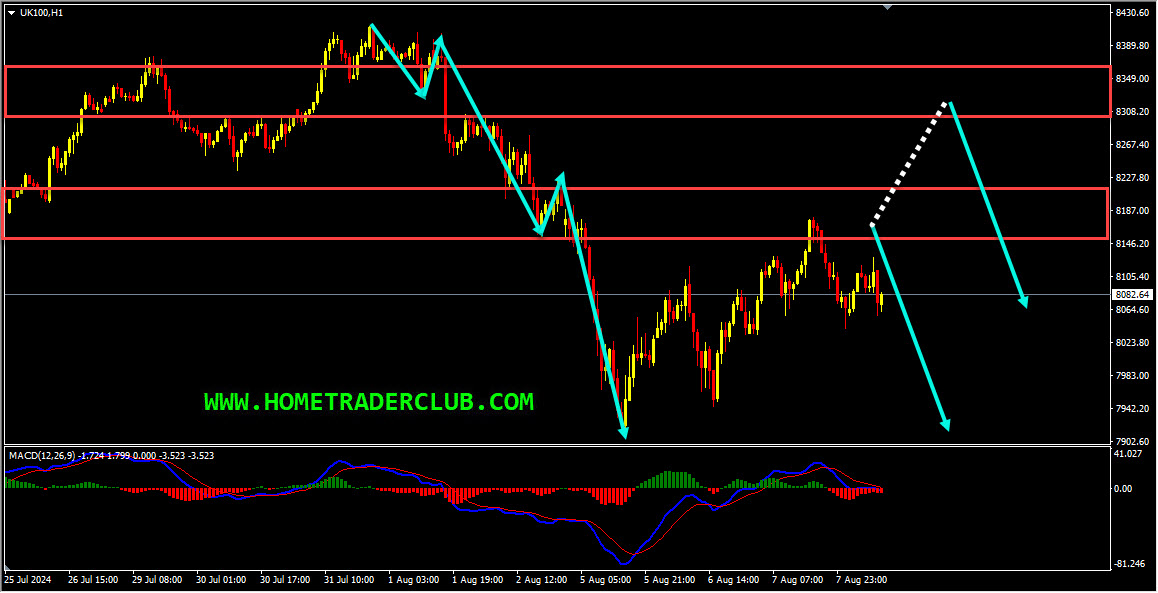
UK100 – My idea here was “Looking at the H1 chart, we could see that the price which is moving lower has created a bearish trend pattern in the form of three lower highs, and lower lows which we may consider as evidence of bearish pressure. Generally, after a bearish trend pattern, we may expect corrections and then a further continuation lower. Currently, it looks like a correction is happening and in addition to this there are no signs opposing this short term bearish view at the moment. Also, we had two strong support zones that have formed, the price moved lower broke below these zones and is holding below them, we may consider this as yet another evidence of bearish pressure. Currently, these strong support zones are acting as strong resistance zones for us. Until these two strong resistance zones (marked in red) shown in the image below hold my short-term view remains bearish here and I expect the price to move lower further”.
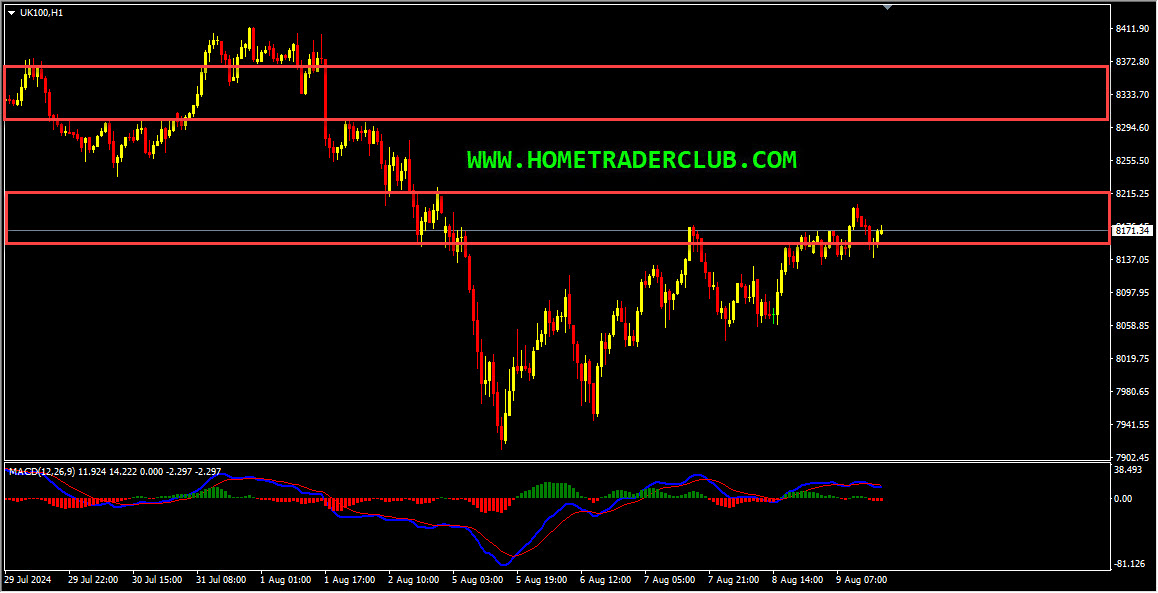
Current Scenario – In UK100, the price action is following the bearish expectations so far. My plan didn’t change here, that is, I expect the price to move lower further in the short term until the two strong resistance zones (marked in red) shown in the image below hold.
For similar trade ideas and much more I invite you to join the Home Trader Club and improve your trading with us.
You will also find a pretty extensive database of educational materials here in the blog – just use the search or check out the Forex Education section above.
If you have any further questions, don’t hesitate to drop a comment below!
Happy Trading!
Arvinth Akash
Home Trader Club Team.
Hi Traders! NZDUSD short term forecast and technical analysis is here. We do our analysis…
We are pleased to officially announce our new partnership with AvaTrade, one of the most…
Hi Traders! EURUSD short term forecast and technical analysis is here. We do our analysis…
Welcome to this week’s Forex forecast. In this analysis, we break down the key technical…
Hi Traders! Arvinth here from the Home Trader Club team. The weekly summary and, review of April…
Stocks and bonds fell as oil surged anew, with President Donald Trump dashing optimism that the war in…