Hi Traders! Weekly summary and review June 11th, 2021 is here. It is now time to recap and summarize the trade setups that we had during this week. Below you will find the short explanation of all the trade setups we had in this week and how it has currently developed now.
First, we will see the trade ideas that I shared in my blog:
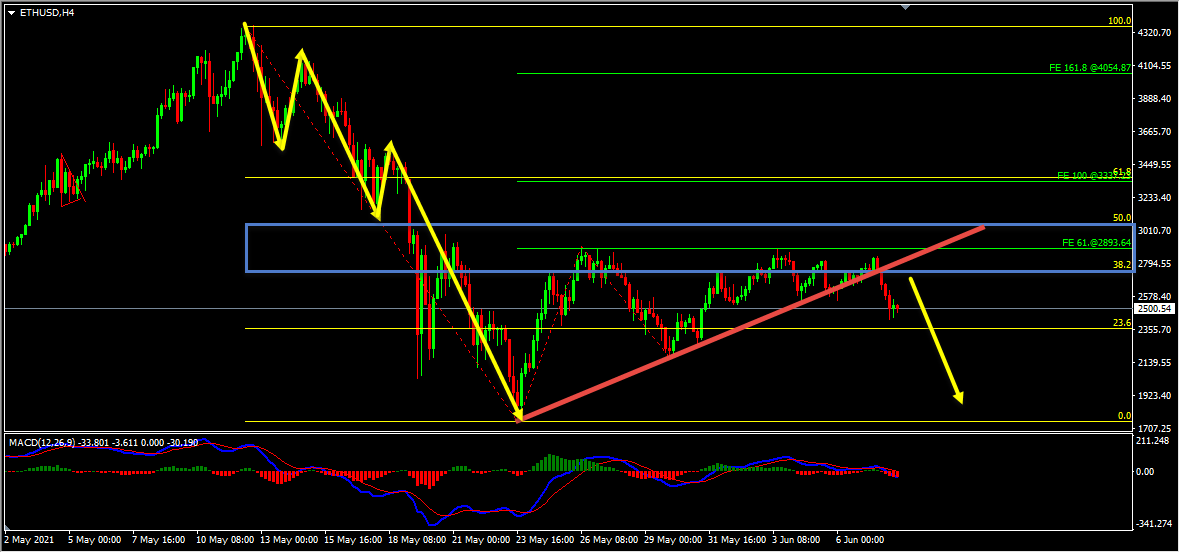
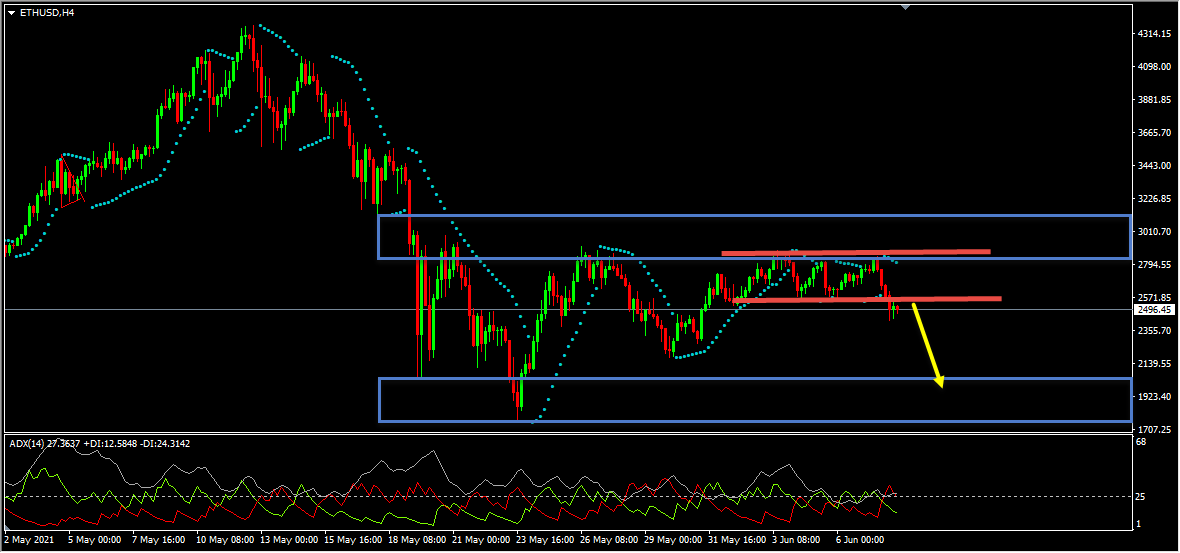
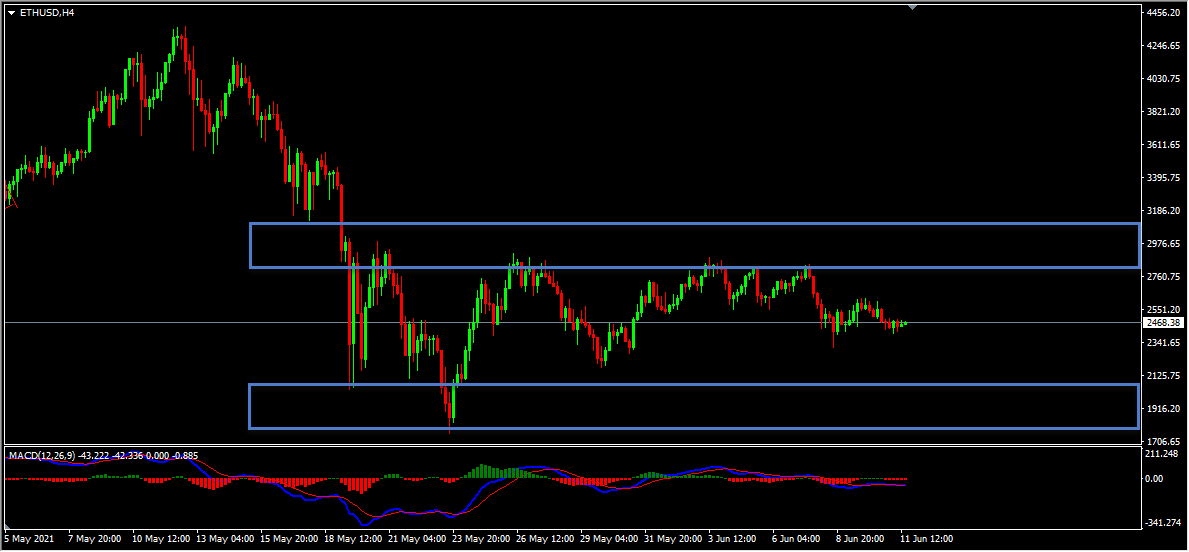
Ethereum – My idea here was “On the H4 chart, the price which was moving lower has created a bearish trend pattern in the form of three lower highs, lower lows which we may consider as evidence of bearish pressure. Generally, after a bearish trend pattern, we may expect corrections and then further continuation lower. Currently it looks like a flat correction is happening in the form of a range. While measuring this bearish trend pattern using the Fibonacci retracement tool we could see that the 38.2%(2751.77) – 50%(3060.27) Fibonacci retracement zones coincide with the top of the range and the 61.8%(2893.64) Fibonacci expansion level of the first wave, which makes this area a key resistance zone for us. The price which was moving higher reached this zone, respected it and is currently moving lower. In addition to this the price which is moving lower has broken below the most recent uptrend line, which we may consider as yet another evidence of bearish pressure.
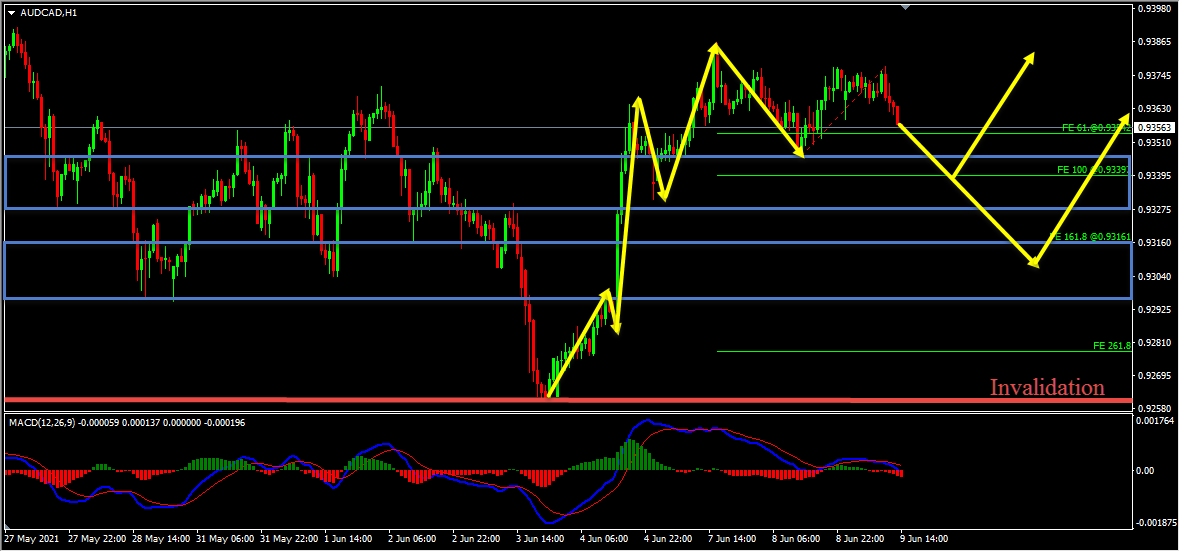
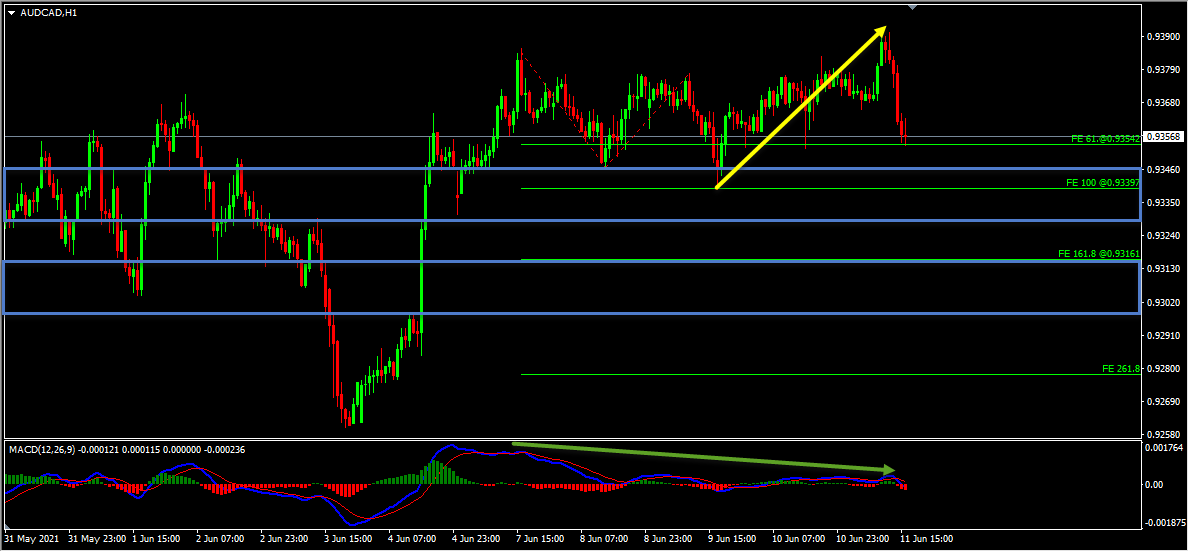
AUDCAD – My idea here was “On the H1 chat the price which is moving higher has created a bullish trend pattern in the form of three higher highs, higher lows, we may consider this as evidence of bullish pressure. Generally, after a bullish trend pattern, we may expect corrections and then potential continuation higher. Currently, it looks like a correction is happening and while measuring the first wave using the Fibonacci expansion tool we have two key support zones that has formed around the 100%(0.93397) Fibonacci expansion level and the 161.8%(0.92161) Fibonacci expansion level. Until both these key support zones hold my view remains bullish here and I expect the price to move higher further. Alternatively if the price moves lower and if we get a valid breakout below the low at 0.92605 then this bullish view will be invalidated”.
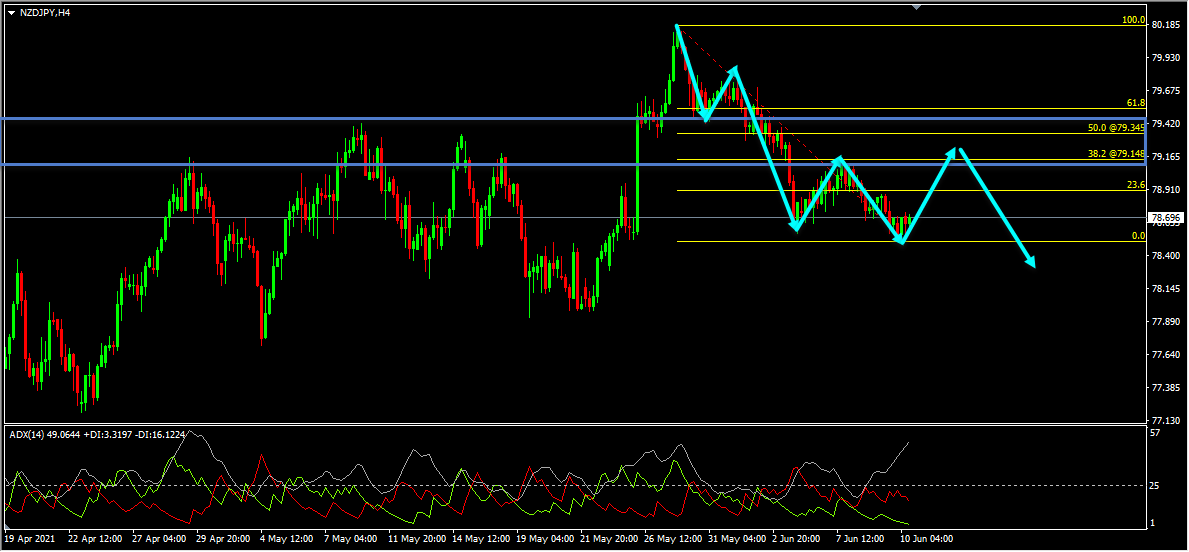
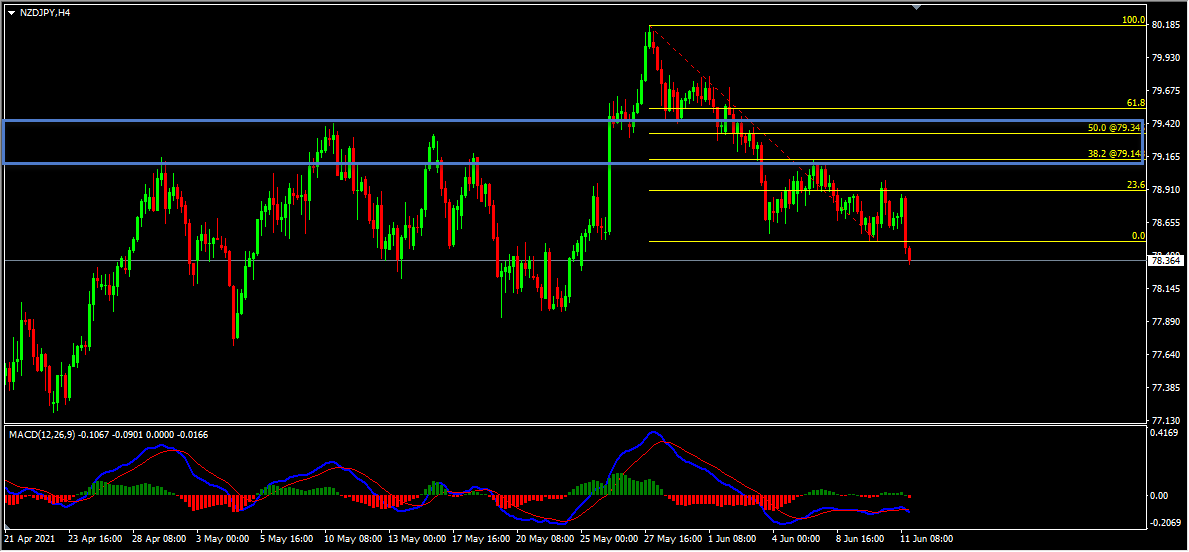
NZDJPY – My idea here was “On the H4 chart, the price which is moving lower has created a bearish trend pattern in the form of three lower highs, lower lows which we may consider as evidence of bearish pressure. Generally, after a bearish trend pattern, we may expect corrections and then further continuation lower. In addition to this, the ADX indicator gave a bearish signal here at the cross of -DI (red line) versus +DI (green line) and the main signal line (silver line) reads value over 25 which we may consider as yet another evidence of bearish pressure. While measuring this bearish trend pattern using the Fibonacci retracement tool we have a key resistance zone that has formed based on the 38.2%(79.148) – 50%(79.345) Fibonacci retracement zones. Until this key resistance zone holds my view remains bearish here and I expect the price to move lower further”.
Note: You can follow me here on Trading View and also on my blog to get similar ideas on daily basis)
For similar trade ideas and much more I invite you to join the Traders Academy Club and improve your trading with us.
You will also find a pretty extensive database of educational materials here in the blog – just use the search or check out the Forex Education section above.
If you have any further questions, don’t hesitate to drop a comment below!
To your success,
Vladimir Ribakov
Certified Financial Technician
The new trading week presents several high-probability opportunities across the forex and commodities markets. After…
Hi Traders! Arvinth here from the Home Trader Club team. The weekly summary and, review of July…
Hi Traders! UK100 short term forecast and technical analysis is here. We do our analysis…
Hi Traders! CADCHF short term forecast follow-up and update is here. On May 14th 2026…
Hi Traders! EURNZD short term forecast and technical analysis is here. We do our analysis…
Hi Traders! AUDCAD short term forecast update and follow up is here. On May 12st…
View Comments
Thank you vld