Hi Traders! Wheat forecast update and follow up is here. On June 11th I shared this Technical Analysis – Wheat Forecast post in my blog. In this post, let’s do a recap of this setup and see how it has developed now. If you would like to learn more about the way we trade and the technical analysis we use then check out the Traders Academy Club. Spoiler alert – free memberships are available!
Missed this trade?
Never miss a trade opportunity again! Join the Traders Academy Club
Now let’s summarize the idea first:
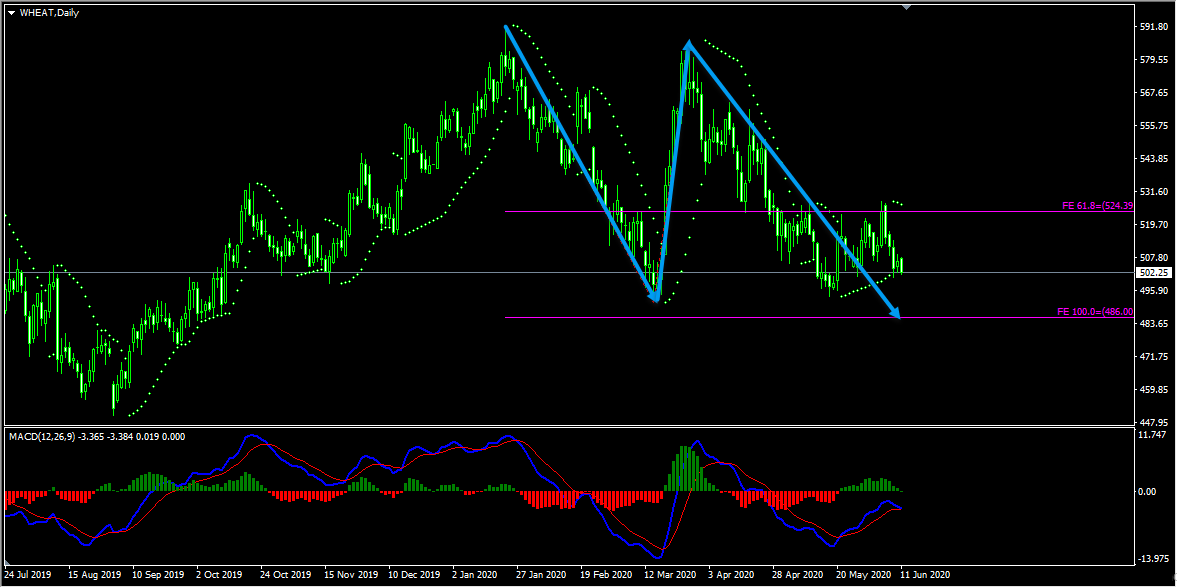
On the daily chart, the price which is moving lower is creating a double wave to the downside. While measuring the fibonacci expansion level of the first wave we have we could see that the price has broken below the first support zone at 61.8% (524.39) fibonacci expansion level, retested it, and is moving lower. The price still has room lower towards the next important support zone at 100% (486.00) fibonacci expansion level. In addition to this based on the Parabolic Sar the dots are above the price which we may consider as evidence of bearish pressure. Also, there are no signs that show the trend is over yet. We may now move down to lower timeframes and see if we can find evidences supporting this bearish view.
On the H4 chart, the price which is moving lower had created a bearish trend pattern that has completed itself. Generally, after a bearish trend pattern we may expect corrections and then further continuation lower. Currently, it looks like the correction that we were looking for has happened in the form of double wave up, we also had a bearish divergence between the first high that has formed at 523.50 and the second high that has formed at 528.25 based on the MACD indicator which we may consider as evidence of bearish pressure. The price then moved lower and broke below the most recent uptrend line and is holding below it. Also based on the Parabolic Sar the dots are above the price we may consider these as other evidences of bearish pressure. So the bottom line here is that the H4 chart has evidence supporting the bearish view.
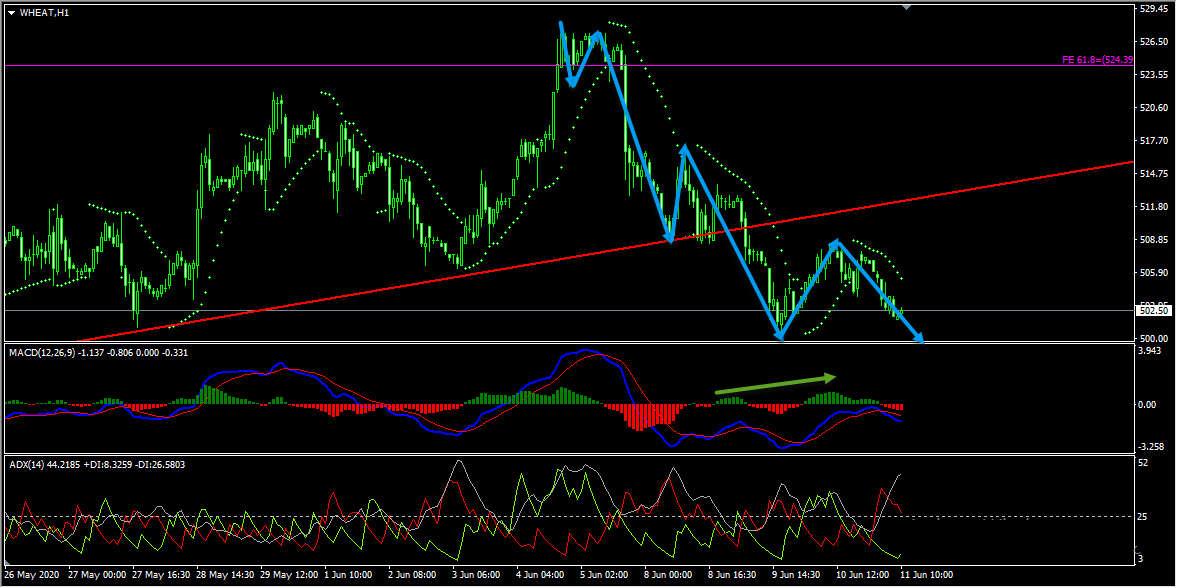
Looking at the H1 chart we could see that the most recent uptrend line breakout on the H4 chart happened in the form of a bearish trend pattern. We then had a correction with the price creating a bearish hidden divergence between the first high that has formed at 513.75 and the second high that has formed at 508.75 based on the MACD indicator which we may consider as evidence of bearish pressure. In addition to this, the ADX indicator gave bearish signal at the cross of -DI (red line) versus +DI (green line) and the main signal line (silver line) reads value over 25, we may consider this as another evidence of bearish pressure. So based on all this, my view remains bearish here and I expect further continuation lower.
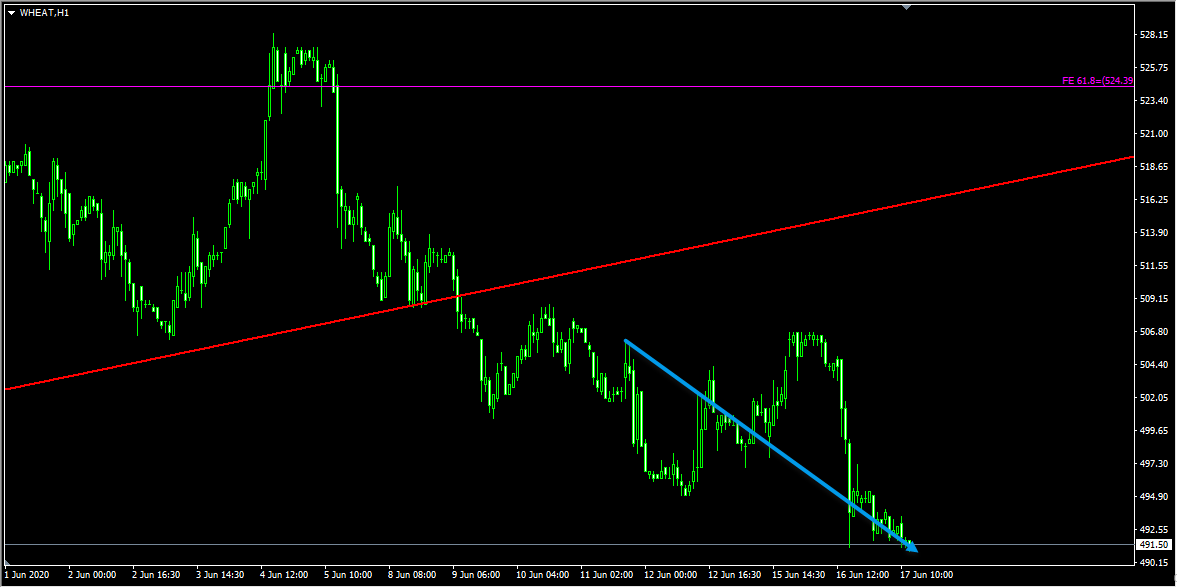
Based on the above-mentioned analysis my view was bearish here and I expected the price to continue lower further. On the H1 chart, the price moved lower exactly as I expected delivering a fantastic move to the downside.
For similar trade ideas and much more join the Traders Academy Club and get access to our complete watch list and trade report.
This is how the report looks like. A table with the hottest market opportunities, screenshot behind every pair and time frame (anything that is in blue inside the table is clickable and leads to a screenshot) + a summary in text format, kind of highlights. And of course Live Market Analysis every single day.
If you have any further questions, don’t hesitate to drop a comment below!
To your success,
Vladimir Ribakov
Certified Financial Technician
The new trading week presents several high-probability opportunities across the forex and commodities markets. After…
Hi Traders! Arvinth here from the Home Trader Club team. The weekly summary and, review of July…
Hi Traders! UK100 short term forecast and technical analysis is here. We do our analysis…
Hi Traders! CADCHF short term forecast follow-up and update is here. On May 14th 2026…
Hi Traders! EURNZD short term forecast and technical analysis is here. We do our analysis…
Hi Traders! AUDCAD short term forecast update and follow up is here. On May 12st…