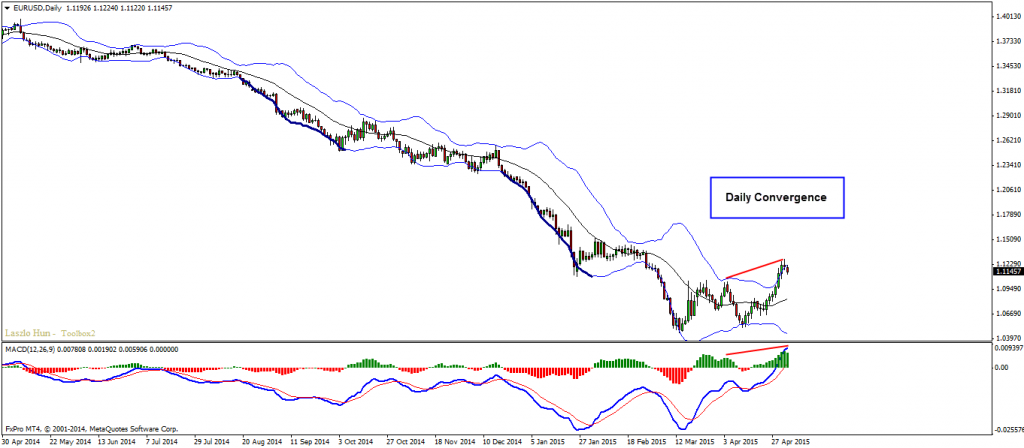
Pair created bullish convergence on the Daily chart for the first time after the long bearish move and this is why I think we should be looking for buy opportunities. The plan here is very simple. We drop down to the H4 chart and
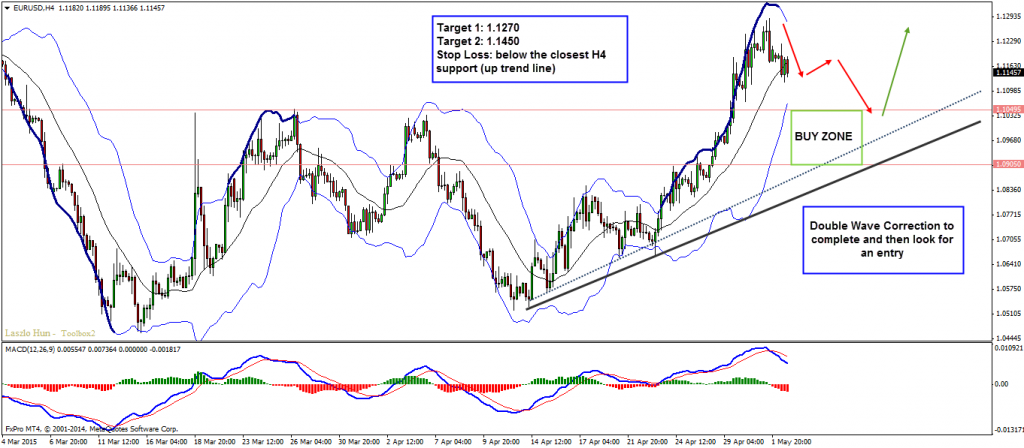
we should be looking for a double wave correction. Ideally the correction should be completed between 1.1050 down to 1.09. There is also a bullish trend line coinciding with this range which will be a great extra confirmation as a dynamic support level. There is hidden bullish divergence on the H4 chart which puts bullish pressure on the pair already already.
Technical Analysis Overview:
D1 – bullish convergence
H4 – bullish hidden divergence, up trend line, support zone, potential double wave correction
Entry:
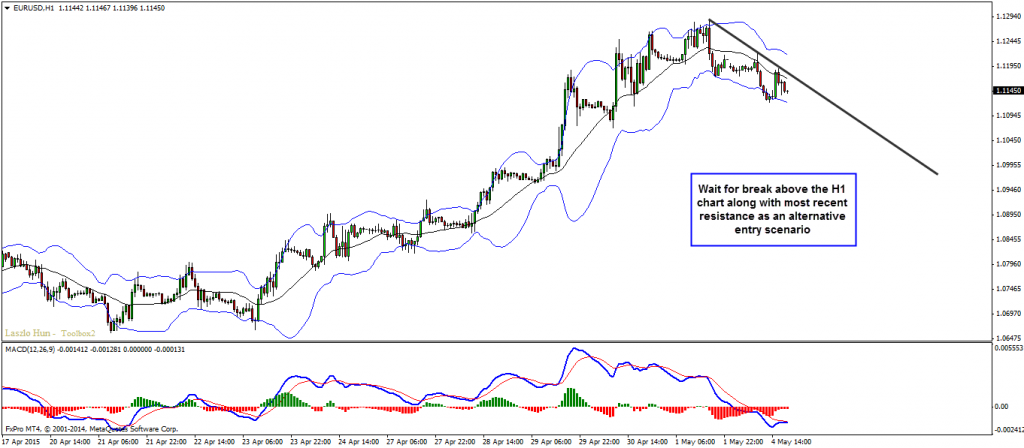
H4 – Look for double wave correction down and go for a buy. Best would be if the price reaches a strong support zone when the correction completes. Ideal levels for an entry are between 1.1050 – 1.0900. More conservative approach would be with the break of the down trend line well spotted on the H1 chart along with the most recent resistance level.
Target 1: 1.1270
Target 2: 1.1450
Stop Loss: below the closest H4 support (up trend line)
Video Explanation
Yours,
Vladimir
EURUSD, GBPUSD, USDJPY, Gold and Bitcoin remain at important technical levels as volatility and geopolitical…
A winning trade feels good. A series of winning trades feels even better. Confidence increases.…
The Forex and commodities markets are entering an interesting phase, with renewed inflation concerns, expectations…
Central banks do more than change interest rates. They also influence financial markets through the…
When traders first learn fundamental analysis, one of the easiest assumptions to make is: Good…
When you open a Forex trade, you may be focused on one thing: Will price…