Hi Traders! CADCHF forecast update and follow up is here. On June 10th I shared this CADCHF Forecast And Technical Analysis in my blog. In this post, let’s do a recap of this setup and see how it has developed now. If you would like to learn more about the way we trade and the technical analysis we use then check out the Traders Academy Club. Spoiler alert – free memberships are available!
Missed this trade?
Never miss a trade opportunity again! Join the Traders Academy Club
Now let’s summarize the idea first:
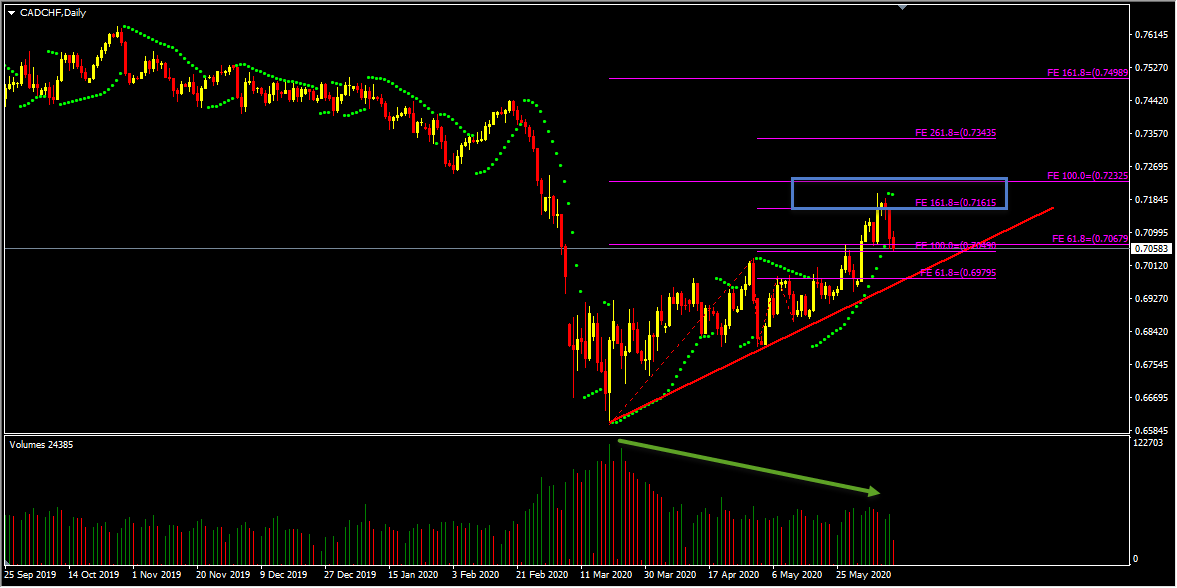
On the daily chart, we have a key resistance zone that has formed based on the 100% fibonacci expansion level of the big wave at 0.72325 and the 161.8% fibonacci expansion level of the small wave at 0.71615. The price which was moving higher reached this key resistance zone, respected it, and is currently moving lower. While looking at the Parabolic Sar we could see that the dots are above the price. Also while looking at the Volumes indicator we could see that the volumes were dropping. We may consider these as evidences of bearish pressure. We also have a good uptrend line that has formed and the price still has room lower towards this dynamic support. We may now move down to lower timeframes and see if we can find evidences supporting this bearish view.
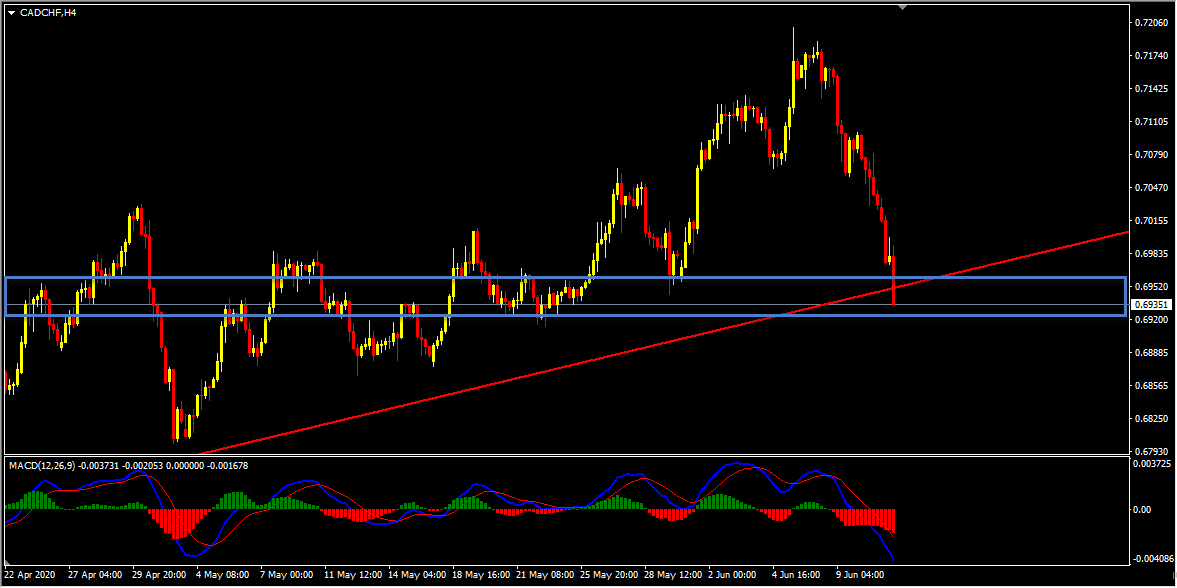
On the H4 chart the price has created a classical setup, we had a bearish divergence that has formed between the first high that has formed on 3rd June 2020 and the second high that has formed on 8th June 2020 based on the MACD indicator. Then the price moved lower and created lower lows between the first low that has formed on 4th June 2020 and the second low that has formed on 9th June 2020 based on the MACD indicator thus forming a bearish convergence for us, we may consider this as evidence of bearish pressure. Also while looking at the Parabolic Sar we could see that the dots are above the price which we may consider as another evidence of bearish pressure. In addition to this the ADX indicator gave bearish signal at the cross of -DI (red line) versus +DI (green line) and the main signal line (silver line) reads value over 25, we may consider this as another evidence of bearish pressure. So the bottom line here is that the H4 chart has evidences supporting the bearish view.
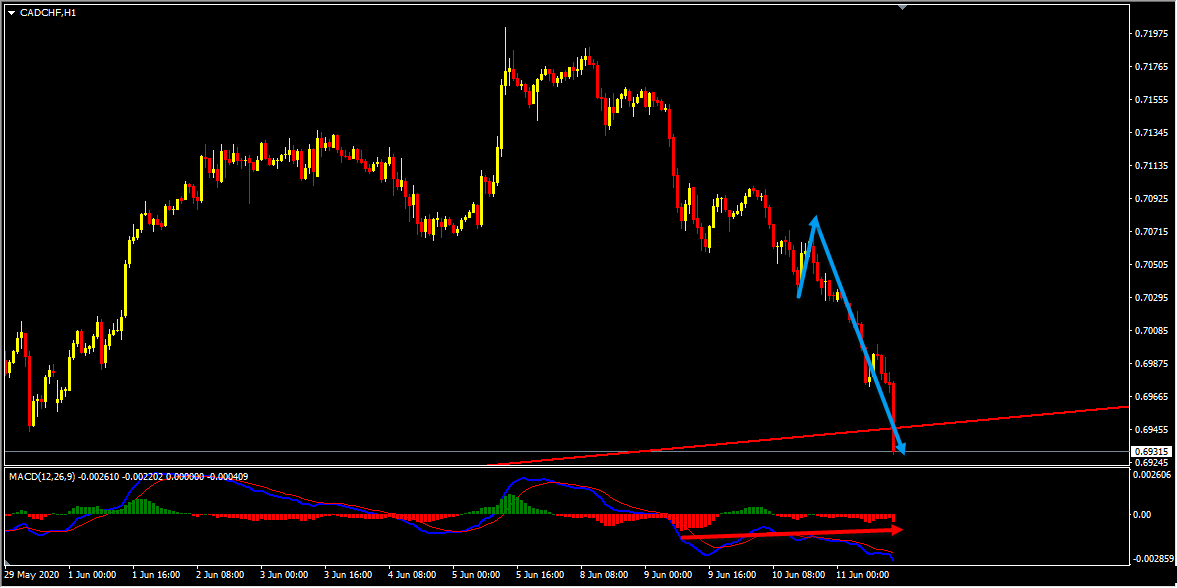
Looking at the H1 chart we could see that the price which is moving lower has created a bearish trend pattern which we may consider as evidence of bearish pressure. In addition to this the ADX indicator gave bearish signal on the H1 chart as well at the cross of -DI (red line) versus +DI (green line) and the main signal line (silver line) reads value over 25, we may consider this as another evidence of bearish pressure. So based on all this, my view remains bearish here and we may expect further continuation lower after retraces.
Based on the above-mentioned analysis my view was bearish here. On the H1 chart, the price has moved perfectly as per my plan. After the bearish trend pattern, the retrace that I was looking for has happened and the price moved lower exactly as I expected, delivering 150+ pips move so far.
Currently, we have a potential bullish divergence that is forming on the H1 chart. Also on the H4 chart the price has reached a strong support zone, this is something that we definitely need to pay attention to. So if you are involved in the sells then this is a very important place to consider and manage your trade (cash out or partial cash out or trailing protections or partial hedge, etc.. depending on the strategy that you work with).
Note: If you want to learn about Money Management you can find it here
CADCHF H4(4 Hours) Chart Current Scenario
For similar trade ideas and much more join the Traders Academy Club and get access to our complete watch list and trade report.
This is how the report looks like. A table with the hottest market opportunities, screenshot behind every pair and time frame (anything that is in blue inside the table is clickable and leads to a screenshot) + a summary in text format, kind of highlights. And of course Live Market Analysis every single day.
If you have any further questions, don’t hesitate to drop a comment below!
Happy Trading!
Yordan Kuzmanov
Chief Trader at the Traders Academy Club
The new trading week presents several high-probability opportunities across the forex and commodities markets. After…
Hi Traders! Arvinth here from the Home Trader Club team. The weekly summary and, review of July…
Hi Traders! UK100 short term forecast and technical analysis is here. We do our analysis…
Hi Traders! CADCHF short term forecast follow-up and update is here. On May 14th 2026…
Hi Traders! EURNZD short term forecast and technical analysis is here. We do our analysis…
Hi Traders! AUDCAD short term forecast update and follow up is here. On May 12st…