Hi Traders! EURNZD forecast follow up and update is here. On June 3rd I shared this EURNZD Forecast And Technical Analysis in my blog. In this post, let’s do a recap of this setup and see how it has developed now. If you would like to learn more about the way we trade and the technical analysis we use then check out the Traders Academy Club. Spoiler alert – free memberships are available!
Missed this trade?
Never miss a trade opportunity again! Join the Traders Academy Club
Now let’s summarize the idea first:
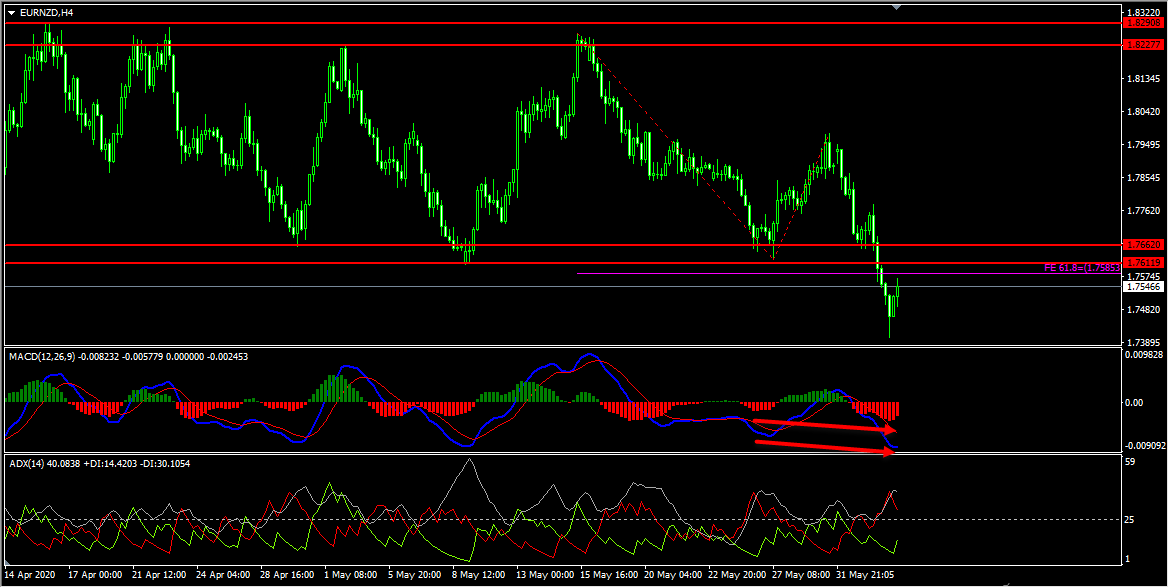
On the H4 chart, the price was moving inside a range, which is formed by the highs and lows reaching parallel resistance and support zones. The price which was respecting this range so far has currently broken below the bottom of this range and is holding below it. In addition to this the price has also created lower lows between the first low that has formed on 27th May 2020 and the second low that has formed on 3rd June 2020 based on the MACD indicator, which we may consider as evidence of bearish pressure. Also, the ADX indicator gave bearish signal at the cross of -DI (red line) versus +DI (green line) and the main signal line (silver line) reads value over 25, we may consider this as another evidence of bearish pressure. We may now move down to lower timeframe and see if we can find evidences supporting this bearish view.
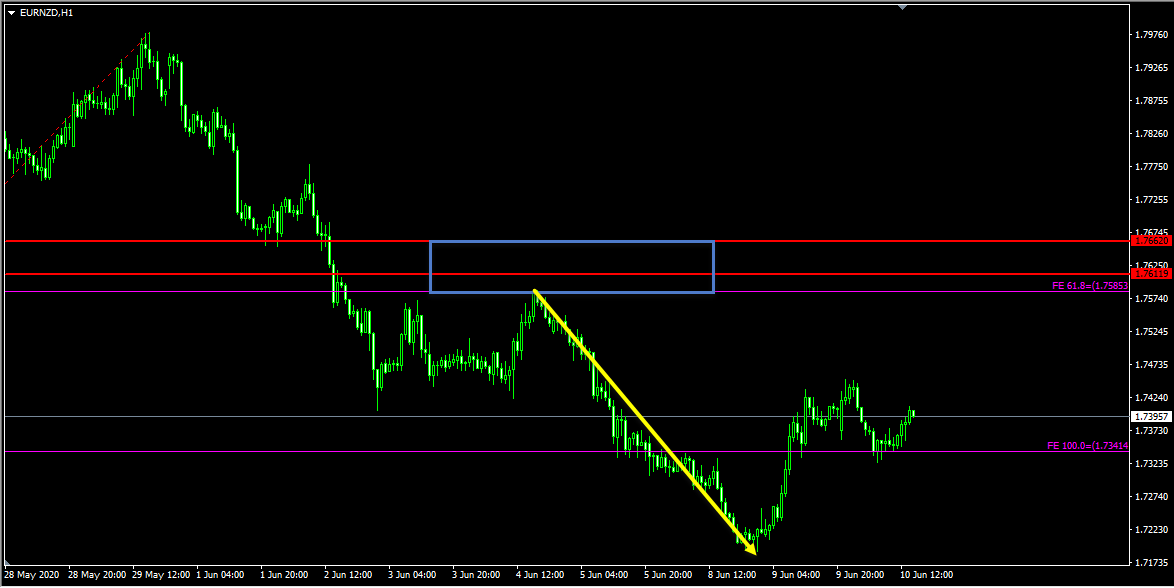
Looking at the H1 chart we could see that the price which is moving lower has created a bearish trend pattern which we may consider as evidence of bearish pressure. Generally, after a bearish trend pattern, we may expect correction and then further continuation lower. Currently, it looks like a correction is happening, we also have a potential bearish hidden divergence that is forming at the moment. Also, the Stochastic Oscillator has reached it’s extreme which we may consider as another evidence of bearish pressure. Until the key resistance zone (marked in blue) shown in the screenshot below holds my short term view remains bearish here and I expect further continuation lower.
Based on the above-mentioned analysis my short term view was bearish here. On the H1 chart, the price has moved perfectly as per my plan. After the bearish trend pattern, the retrace that I was looking for has happened. The price respected the key resistance zone and moved lower exactly as I expected delivering around 400 pips move.
So, traders, this is why I wanted to show this example to help you understand how important it is to follow the facts. When the facts do happen as we expected you can see how the price perfectly moved as per the plan. Because these are the kind of hints the market provides us at majority of the times and it’s our obligation as traders to be able to listen to these things that the market tells us and we should try to make the right actions”.
For similar trade ideas and much more join the Traders Academy Club and get access to our complete watch list and trade report.
This is how the report looks like. A table with the hottest market opportunities, screenshot behind every pair and time frame (anything that is in blue inside the table is clickable and leads to a screenshot) + a summary in text format, kind of highlights. And of course, Live Market Analysis every single day.
If you have any further questions, don’t hesitate to drop a comment below!
To your success,
Vladimir Ribakov
Certified Financial Technician
The new trading week presents several high-probability opportunities across the forex and commodities markets. After…
Hi Traders! Arvinth here from the Home Trader Club team. The weekly summary and, review of July…
Hi Traders! UK100 short term forecast and technical analysis is here. We do our analysis…
Hi Traders! CADCHF short term forecast follow-up and update is here. On May 14th 2026…
Hi Traders! EURNZD short term forecast and technical analysis is here. We do our analysis…
Hi Traders! AUDCAD short term forecast update and follow up is here. On May 12st…