Hi Traders! Cotton forecast update and follow up is here. On May 21st I shared this Cotton Forecast And Technical Analysis in my blog. In this post, let’s do a recap of this setup and see how it has developed now. If you would like to learn more about the way we trade and the technical analysis we use then check out the Traders Academy Club. Spoiler alert – free memberships are available!
Missed this trade?
Never miss a trade opportunity again! Join the Traders Academy Club
Now let’s summarize the idea first:
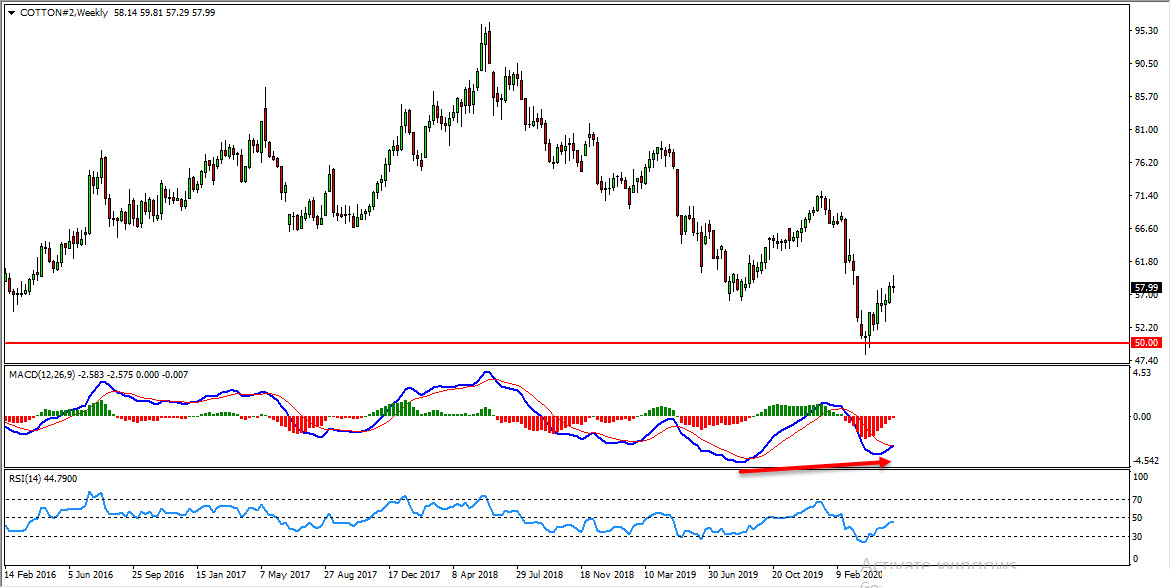
On the weekly chart, the price which was moving lower reached an important psychological round number 50 level. In addition to this, we had a bullish divergence which has formed between the first low that has formed on 25th August 2019 and the second low that has formed on 29th March 2020 based on the moving averages of the MACD indicator which we may consider as evidence of bullish pressure. The price created a false break of this psychological level, respected it, and is currently moving higher.
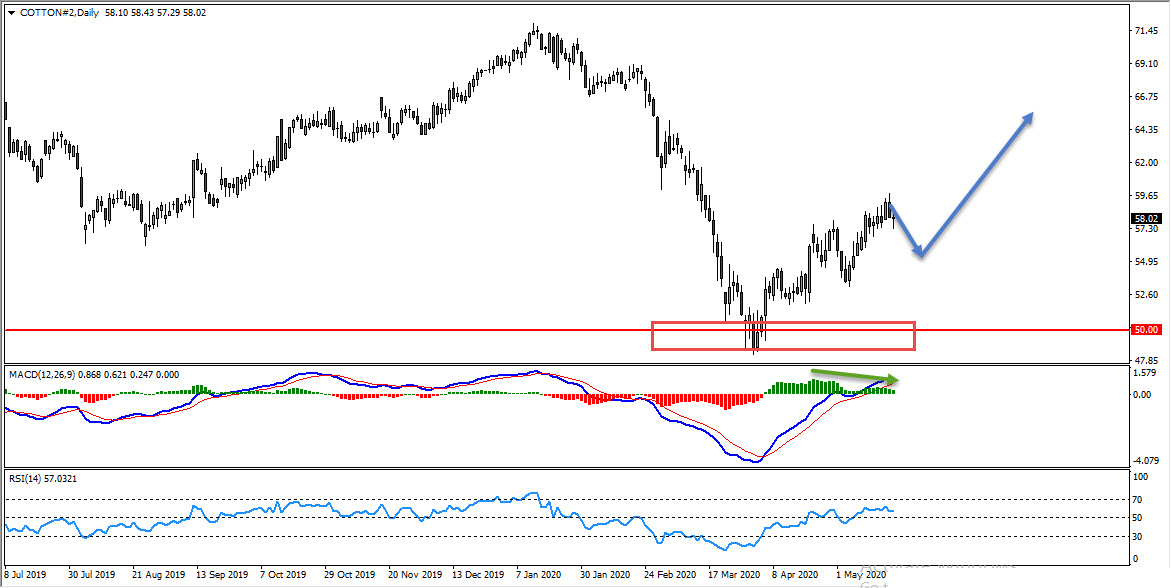
Looking at the daily chart we could see that the price which is moving higher has created a continuing bearish divergence. This continuing bearish divergence is formed between the first high that has formed on 30th April 2020 and the second high that has formed on 20th April 2020 based on the histogram of the MACD indicator, which we may consider as an evidence of bearish pressure. Based on all this we may now expect short term retraces and then further continuation higher.
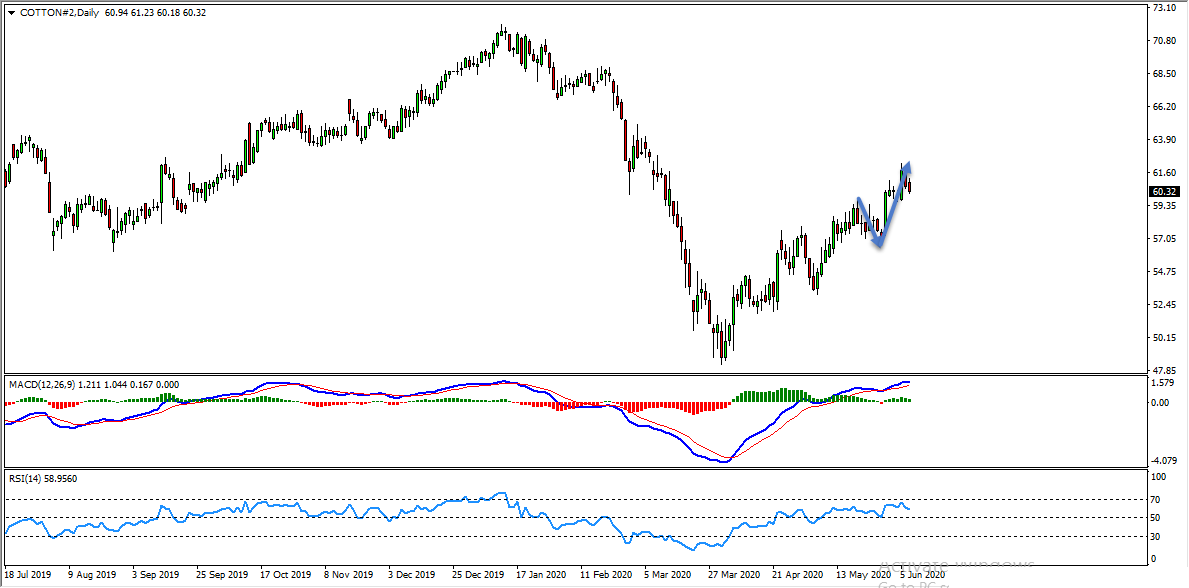
Based on the above-mentioned analysis I expected to see retraces and further continuation higher. The price moved perfectly as per my analysis, we got the retrace and then the price moved higher exactly as I expected.
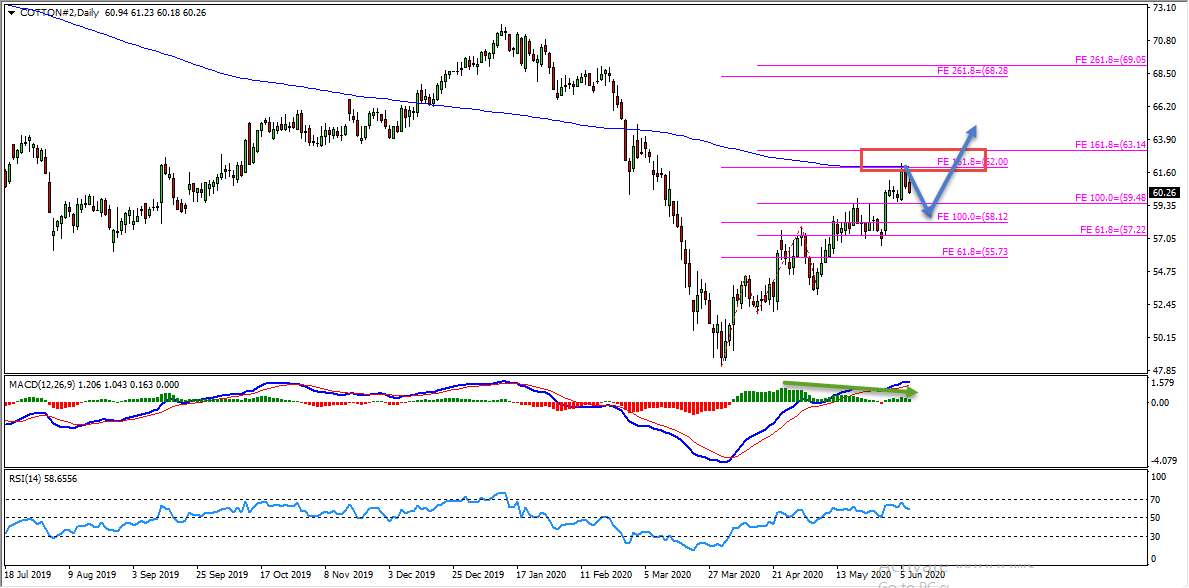
Currently, the price has reached a strong resistance zone formed by the 161.8% fibonacci expansion levels of the first wave at 62.00 and the second wave at 63.14 and the 200 moving averages. Also currently we have bearish divergence between the first high that has formed on 23rd April 2020 and the second high that has formed on 5th June 2020. So if you are involved in the buys then this is a very important place to consider and manage your trade (cash out or partial cash out or trailing protections or partial hedge, etc.. depending on the strategy that you work with).
Note: My long term view still remains bullish here. You can find a detailed explanation regarding this in my Forex Weekly Forecast Video and Forex Weekly Forecast Text Format.
For similar trade ideas and much more join the Traders Academy Club and get access to our complete watch list and trade report.
This is how the report looks like. A table with the hottest market opportunities, screenshot behind every pair and time frame (anything that is in blue inside the table is clickable and leads to a screenshot) + a summary in text format, kind of highlights. And of course, Live Market Analysis every single day.
If you have any further questions, don’t hesitate to drop a comment below!
To your success,
Vladimir Ribakov
Certified Financial Technician
Hi Traders! Arvinth here from the Home Trader Club team. The weekly summary and, review of June…
U.S. stocks rebounded on Thursday with semiconductor shares leading gains as optimism about a Middle…
Hi Traders! USDCAD short term forecast and technical analysis is here. We do our analysis…
Hi Traders! Ethereum short term forecast update and follow up is here. On April 30th,…
Hi Traders! GBPAUD short term forecast and technical analysis is here. We do our analysis…
Hi Traders! Gold short term forecast update and follow up is here. On April 22nd,…