Hi Traders! Dollar Index forecast follow up and update is here. On April 6th I shared this “Technical Analysis – Dollar Index Forecast” post in our blog. In this post, let’s do a recap of this setup and see how it has developed now. If you would like to learn more about the way we trade and the technical analysis we use then check out the Traders Academy Club. Spoiler alert – free memberships are available!
My Idea:
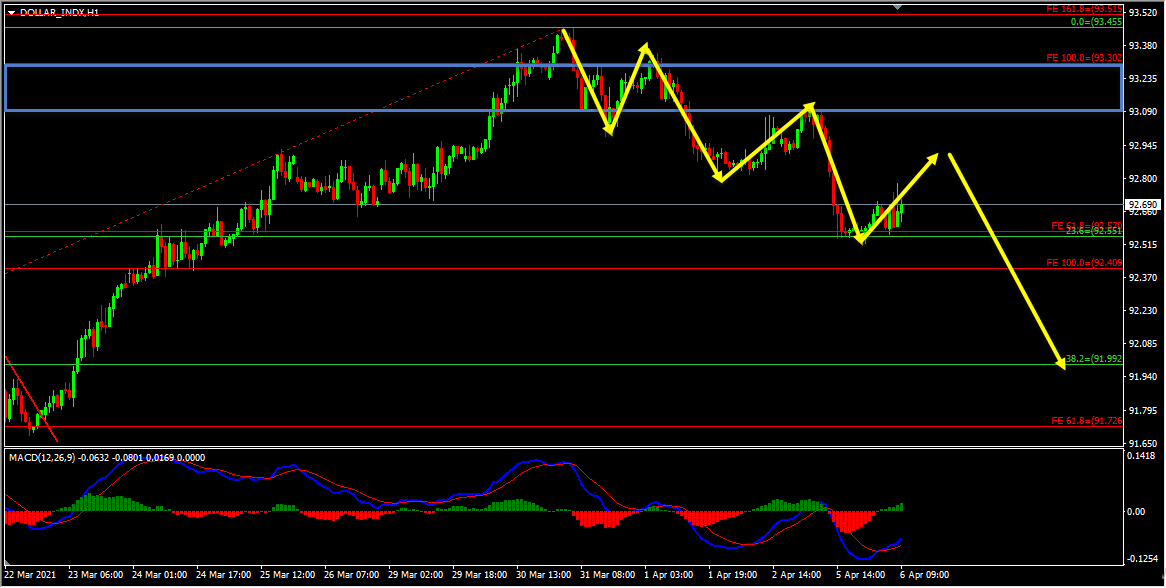
On the H1 chart, the price which is moving lower has created a bearish trend pattern in the form of three lower highs, lower lows which we may consider as evidence of bearish pressure. Generally, after a bearish trend pattern, we may expect corrections and then further continuation lower. Currently, it looks like the correction that we are looking for is happening. Also, we have a strong support zone that has formed and the price which is moving lower has broken below this zone and is holding below it, we may consider this as another evidence of bearish pressure. Currently, this strong support zone is acting as a strong resistance zone for us. Until this strong resistance zone holds my short term view remains bearish here and I expect the price to continue lower further after correction.
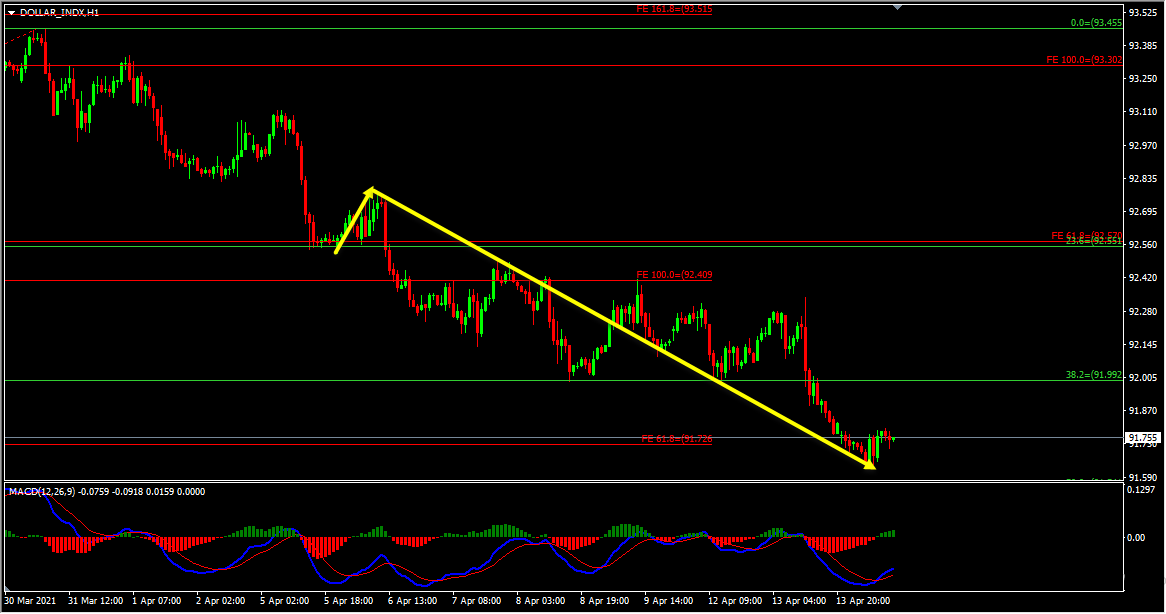
On the H1 chart my view was bearish and I was expecting the price to move lower further until the strong resistance zone holds. After the bearish trend pattern, we had a pullback, and most importantly the price was holding below the strong resistance zone. The price then moved lower further as I expected it to and delivered an excellent move to the downside move so far.
(Note: You can learn about a Killer Forex Strategy “Double Trend Line Principle” here)
(Note: You can follow us here on Trading View and also on our blog to get similar ideas on a daily basis)
For similar trade ideas and much more join the Traders Academy Club and get access to our complete watch list and trade report.
This is how the report looks like. A table with the hottest market opportunities, screenshot behind every pair and time frame (anything that is in blue inside the table is clickable and leads to a screenshot) + a summary in text format, kind of highlights. And of course Live Market Analysis every single day.
If you have any further questions, don’t hesitate to drop a comment below!
Happy Trading!
Yordan Kuzmanov
Chief Trader at the Traders Academy Club
We are pleased to officially announce our new partnership with AvaTrade, one of the most…
Hi Traders! EURUSD short term forecast and technical analysis is here. We do our analysis…
Welcome to this week’s Forex forecast. In this analysis, we break down the key technical…
Hi Traders! Arvinth here from the Home Trader Club team. The weekly summary and, review of April…
Stocks and bonds fell as oil surged anew, with President Donald Trump dashing optimism that the war in…
Hi Traders! GBPCAD short term forecast and technical analysis is here. We do our analysis…