Hi Traders! EURGBP forecast and technical analysis post is here. We do our analysis on the MetaTrader4 platform (MT4), some very interesting, useful tips and hacks about the MT4 platform could be found here. As we do in every technical analysis post we are going to perform the multi-timeframe technical analysis on this pair in order to find possible trading opportunities. If you would like to learn more about the way we trade and the technical analysis we use then check out the Traders Academy Club Spoiler alert – free memberships are available! Let’s start our analysis now from the highest timeframe which will be the daily chart here.
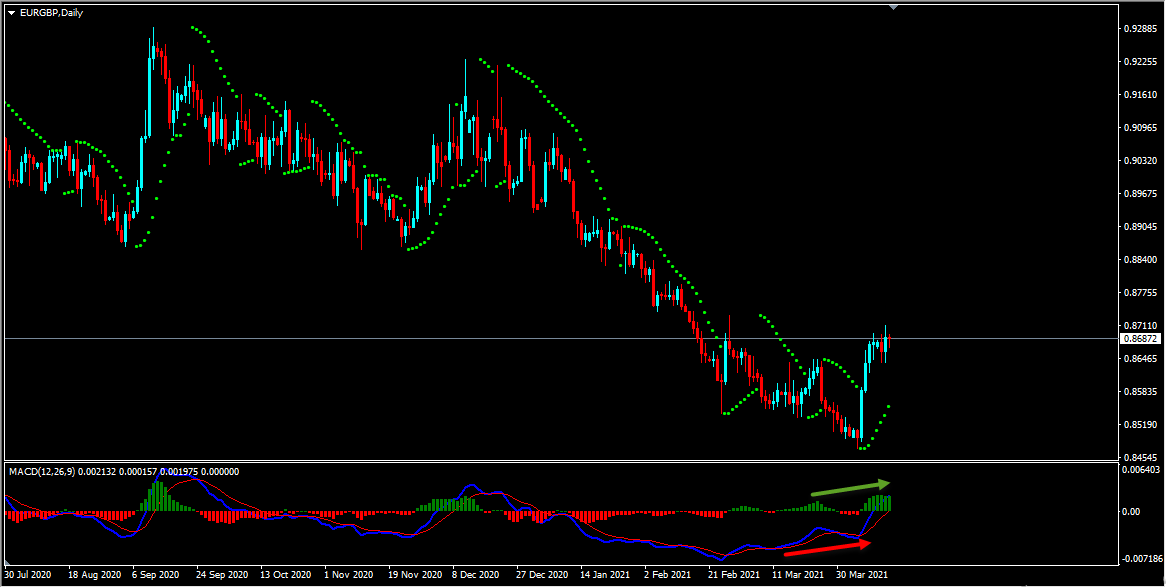
On the daily chart we have a bullish divergence that has formed between the first low that has formed at 0.85327 and the second low that has formed at 0.84714 based on the MACD indicator. Then the price moved higher and broke above the high at 0.86445 creating higher highs, thus forming a classical setup of bullish divergence followed by bullish convergence. Hence as per the book scenario, after a bullish convergence, we may look for corrections to happen and then further continuation to the upside. Also based on the Parabolic Sar we could see that the dots are below the price which we may consider as another evidence of bullish pressure. We may now move down to lower timeframe and see if we can find evidences supporting this bullish view.
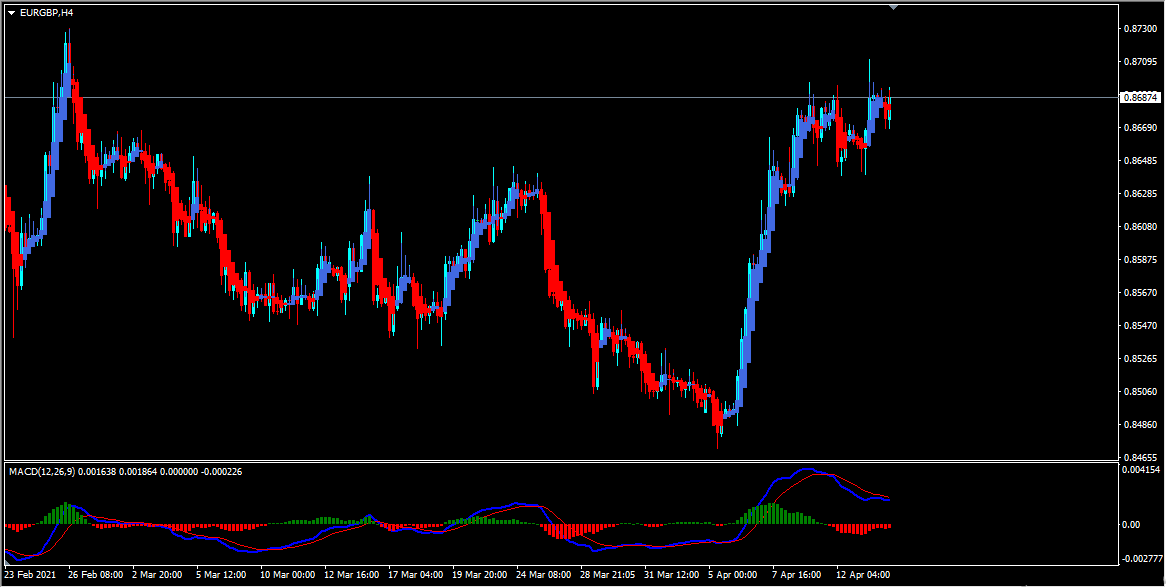
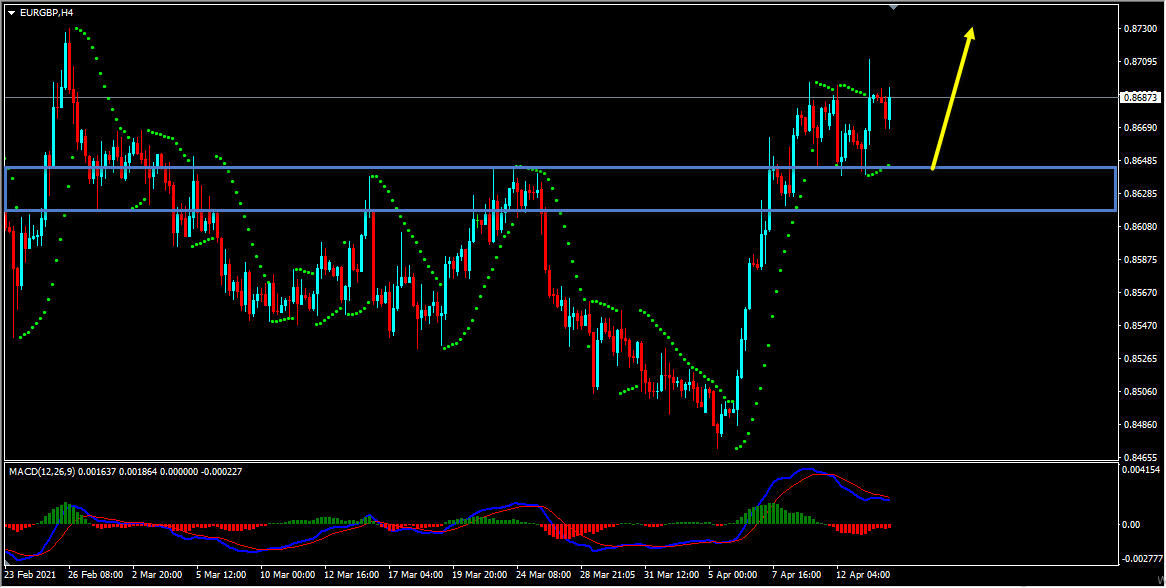
On the H4 chart, we have a bullish rally and it looks like this bullish rally is about to continue itself as there are no signs that show this bullish trend is over yet. So until we get any opposite signs my view remains bullish here. In addition to this, based on the Heikin Ashi candles we can see that currently, we have strong bullish bodies in upward moving market conditions so it basically reflects a bullish environment.
EURGBP D1(Daily) Chart Analysis
EURGBP H4(4 Hours) Chart Analysis
It is always recommended to look for confirmations before you jump into any trade. If you are not sure about how to trade this buy setup then you can use any setup and strategy that you have in your arsenal to look for bullish moves and join this buy trade.
Also, don’t forget to protect your buy trade using a stop loss and make sure to set a target and keep a proper risk/reward ratio.
You will also find a pretty extensive database of educational materials here in the blog – just use the search or check out the Forex Education section above.
Not sure how to enter a trade? Spot reversals (bounces)? Not sure how to spot breakouts?
I invite you to join us in our live market analysis, on daily basis, and improve your trading with us.
Also, you can get one of our strategies free of charge. You will find all the details here
If you have any further questions, don’t hesitate to drop a comment below!
To your success,
Vladimir Ribakov
Certified Financial Technician
Hi Traders! USDCHF short term forecast update and follow up is here. On May 20th,…
Hi Traders! CADCHF short term forecast and technical analysis is here. We do our analysis…
The dollar was broadly steady on Monday as cautious investors watched out for signals on…
Hi Traders! Arvinth here from the Home Trader Club team. The weekly summary and, review of July…
European markets edged lower on Thursday following more overnight volatility in Asia’s tech-dominated indexes, while…
Hi Traders! EURGBP short term forecast and technical analysis is here. We do our analysis…