Hi Traders! In this article we are going to see the three best ways to trade with the Engulfing candle pattern.
Note: The higher the timeframe you find the engulfing on – the more reliable it will be!
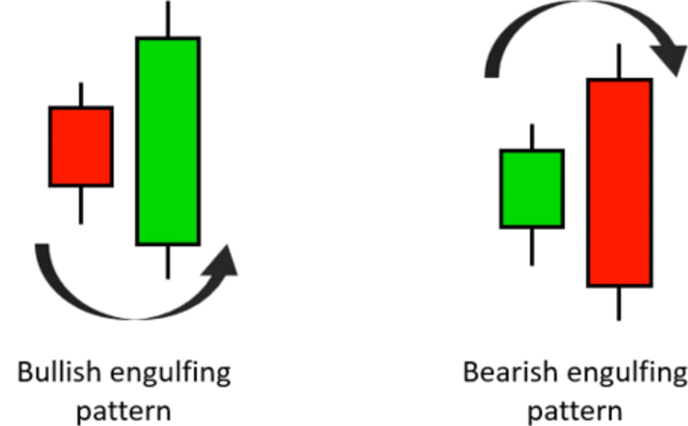
This is how the Engulfing candle pattern looks like:
In the above screenshot the one you see on the left side is the “Bullish Engulfing Pattern” that is we had a bearish move which finished with a red candle which is engulfed completely by the next green candle.
Whereas the “Bearish Engulfing Pattern” is the opposite, that is after a rally which finished with a green candle and followed by a red candle which completely engulfs or covers the previous green candle.
Engulfing could be separated by two, that is full or regular, I will now explain the differences between them.
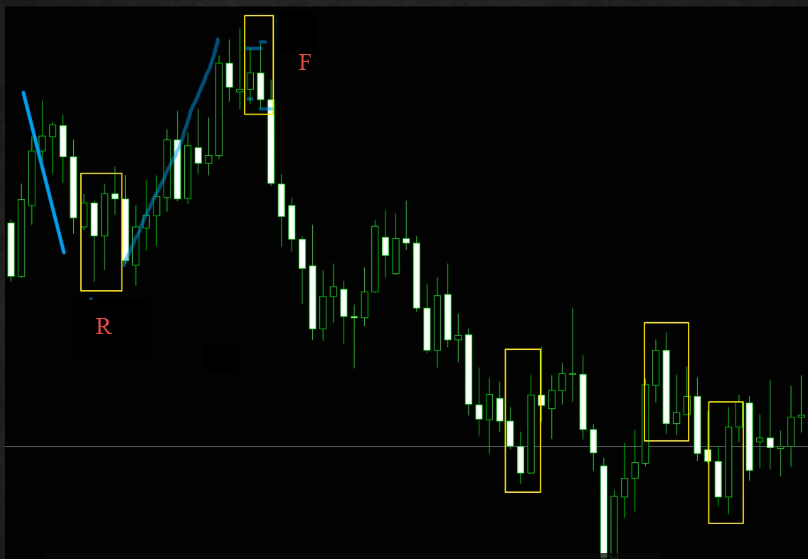
In the below chart you can find few more examples of regular and full engulfing candle pattern.
(Note: “R” denotes regular engulfing and “F” denotes full engulfing)
In my POV the three best ways to use the engulfing are as follows:
1. Created parallel to a false breakout and confirming it!
2. On Top/Bottom of channels.
3. Confirmed with divergence.
Lets start with the first one:
As you can see on the screenshot above we had a high and the market was trying to break the previous high but it failed and right at the end of the candle we had an engulfing pattern (full).
Then we got a move down and we got the false break of the previous low (as shown in the screenshot above) and right after that we got a bullish engulfing. Similarly you can find the next false break of the low and high with engulfing candle pattern and then as per our expectation the price moved in the direction of the engulfing candle pattern.
This is the first very powerful method to use, don’t try to find it on 1 minute or 5 minutes chart which will be a waste of time because it will be amazingly strong on the higher timeframes like Weekly, Daily and 4 Hours chart.
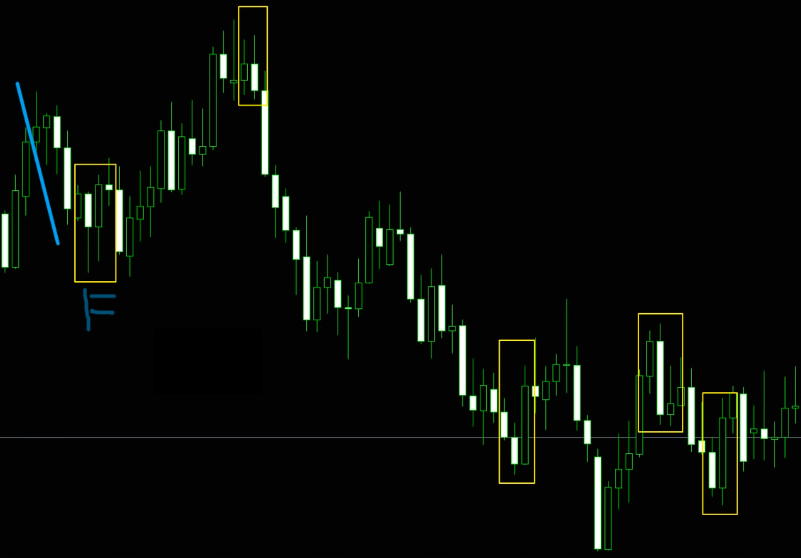
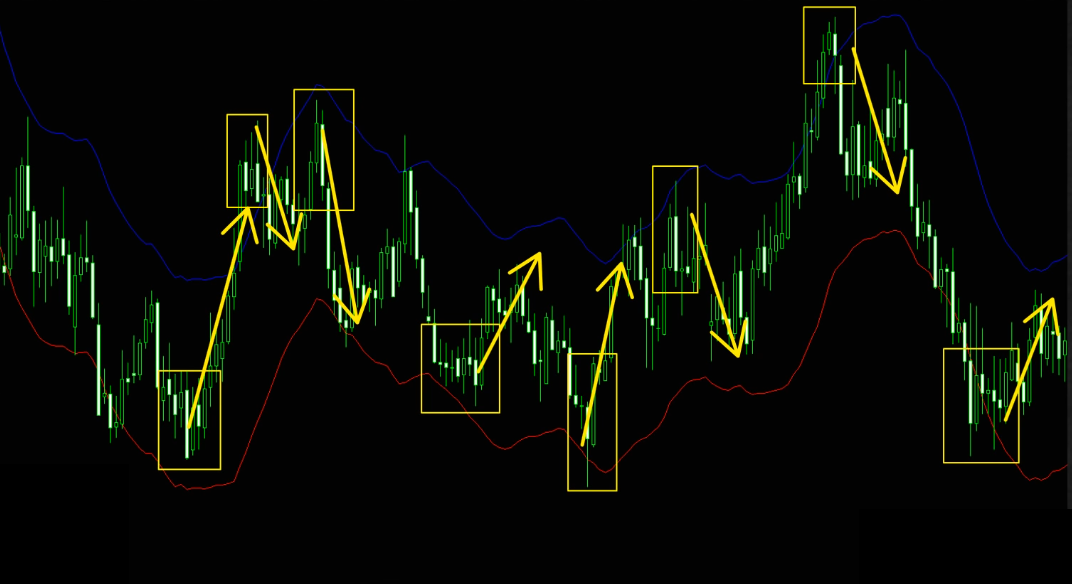
Channels could be parallel lines or it could be ranges, it could be in any kind of pattern even Bollinger Bands or any other band just like I had used in the example. It doesn’t matter what indicator is used to create channels as long as you have the majority of the tops and bottoms with the channel you choose to use is relevant to the current market conditions. So our idea here is very simple we want to see the engulfing pattern right at the top or bottom, ideally even trying to false break above or below the channel according to the scenario. In the below chart you can find the examples of the engulfing candle patterns right at the top and bottom of the channel.
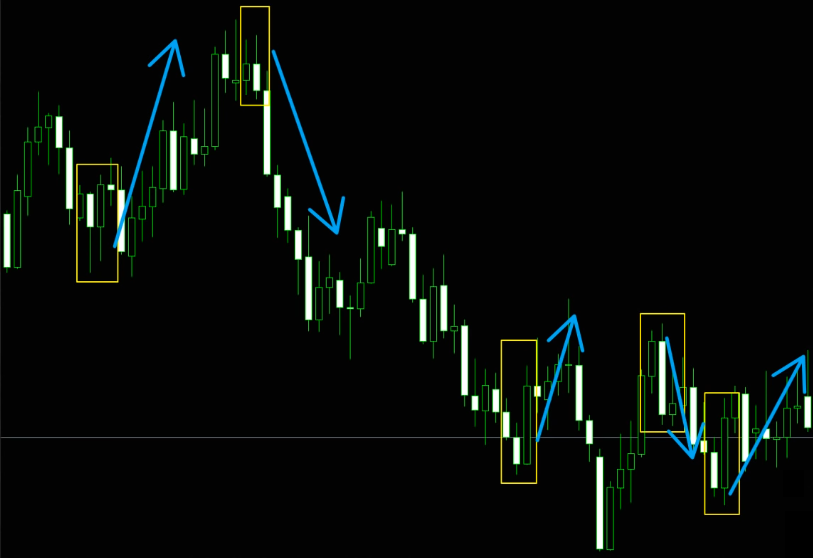
All these engulfing candle patterns came at the boundaries of the channel (very close to it or slightly out of it). Once again the expectation for the moves after such engulfing are towards the direction of the engulfing.
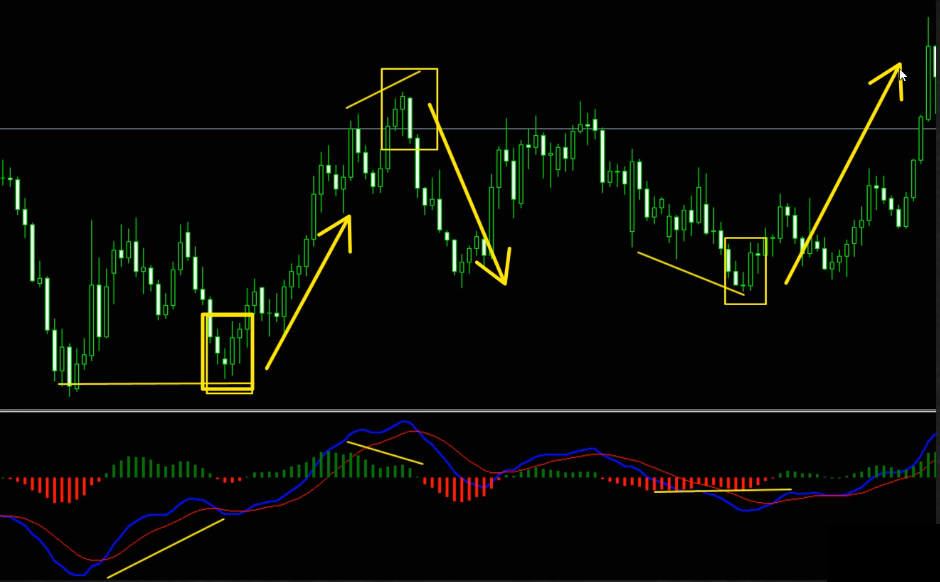
This is my personal favorite style, if you are new to the world of divergence then no worries, you can learn more in-depth insights about divergences, you can benefit greatly from the videos on my channel while also embarking upon Divergence University for comprehensive divergence education.
Generally divergence is a situation where the price and the indicator (it can be any indicator, I personally use the MACD) gives you different picture at the end of a trend. So if you have a bullish trend then you are comparing the higher highs on the chart versus the highs on the indicator, in this case MACD ( it could be histogram, moving average or both, it doesn’t matter) and you would see opposite directions, that is higher highs on the chart and lower highs on the indicator, this is called a Bearish Divergence. Whereas a Bullish divergence is if in a downtrend we have lower lows on the chart versus higher lows on the indicator then that’s a hint for the reversal to the upside.
That’s pretty much it about the best three ways to use the most powerful engulfing candle stick pattern. I personally love this and I would suggest you to practice visually on the charts, don’t try to go to the lower timeframes, start from the higher timeframe (for example daily or 4 Hours chart) try the above mentioned combinations and you will see why this is considered to be such a powerful and reliable candle pattern.
Watch the Webinar of How To Trade The Engulfing Candle Pattern Here:
I invite you to join me in my live trading rooms, on daily basis, and improve your trading with us.
Also you can get one of my strategies free of charge. You will find all the details here
Thank you for your time reading this article.
To your success,
Vladimir Ribakov
The new trading week presents several high-probability opportunities across the forex and commodities markets. After…
Hi Traders! Arvinth here from the Home Trader Club team. The weekly summary and, review of July…
Hi Traders! UK100 short term forecast and technical analysis is here. We do our analysis…
Hi Traders! CADCHF short term forecast follow-up and update is here. On May 14th 2026…
Hi Traders! EURNZD short term forecast and technical analysis is here. We do our analysis…
Hi Traders! AUDCAD short term forecast update and follow up is here. On May 12st…