Hi Traders! EURGBP forecast update and follow up is here. On May 27th I shared this “EURGBP Forecast And Technical Analysis” in this post lets do a recap of this setup and see how it has developed now. If you would like to learn more about the way we trade and the technical analysis we use then check out the Traders Academy Club. Spoiler alert – free memberships are available!
Missed this trade?
Never miss a trade opportunity again! Join the Traders Academy Club
Now let’s summarize the idea first:
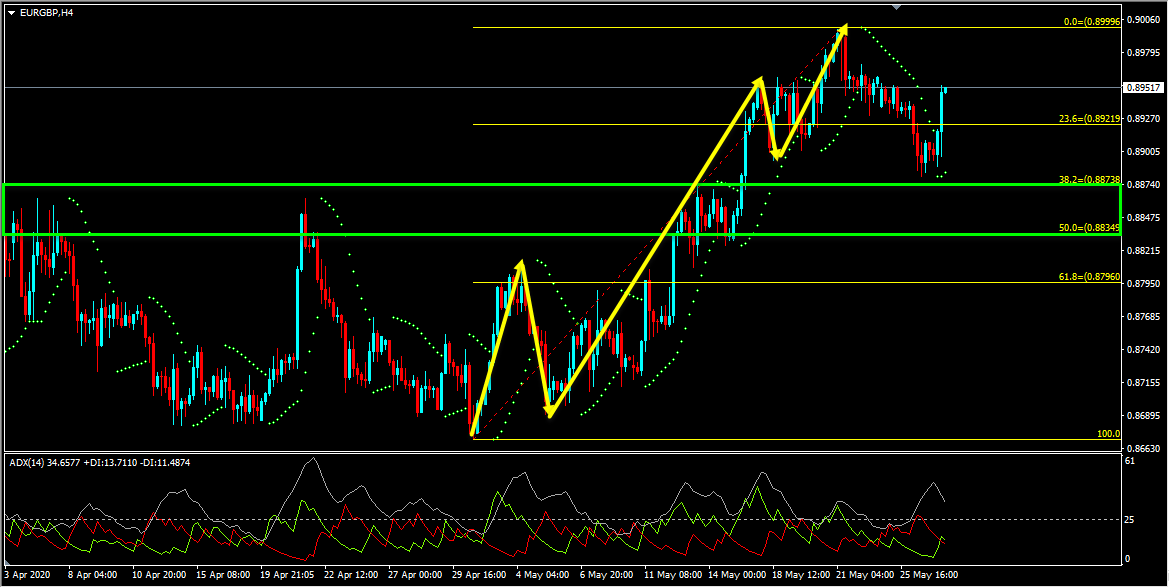
On the H4 chart the price which was moving higher has created a bullish trend pattern that had completed itself, we may consider this as evidence of bullish pressure. Generally, after a bullish trend pattern we may expect corrections and then potential continuation higher. Currently it looks like a correction is happening. We also had a strong resistance zone that had formed which the price has broken above and currently this strong resistance zone is acting as a strong support zone for us. While measuring the bullish trend pattern using the fibonacci retracement tool, we could see that the 38.2% fibonacci retracement level at 0.88738 and the 50% fibonacci retracement level at 0.88349 coincides exactly with the strong support zone which makes this area a key support zone for us. Also while looking at the Parabolic Sar we could see that the dots are below the price which we may consider as evidence of bullish pressure. In addition to this the ADX indicator gave a bullish signal at the cross of +DI (green line) versus -DI (red line) and the main signal line (silver line) reads value over 25, we may consider this as another evidence of bullish pressure. So until the key support zone (marked in green) holds my view remains bullish here.
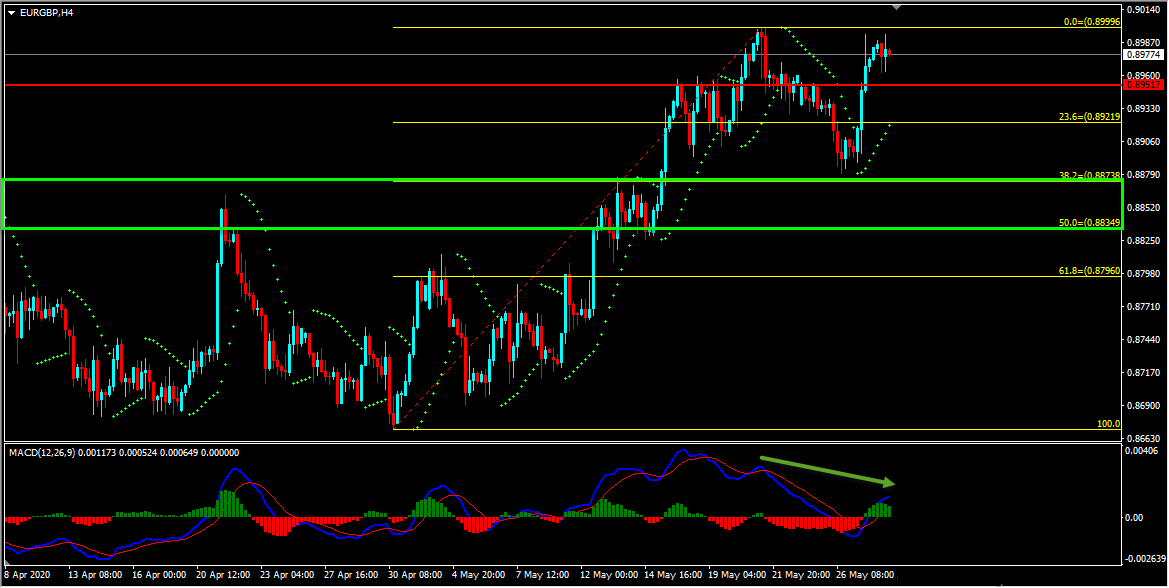
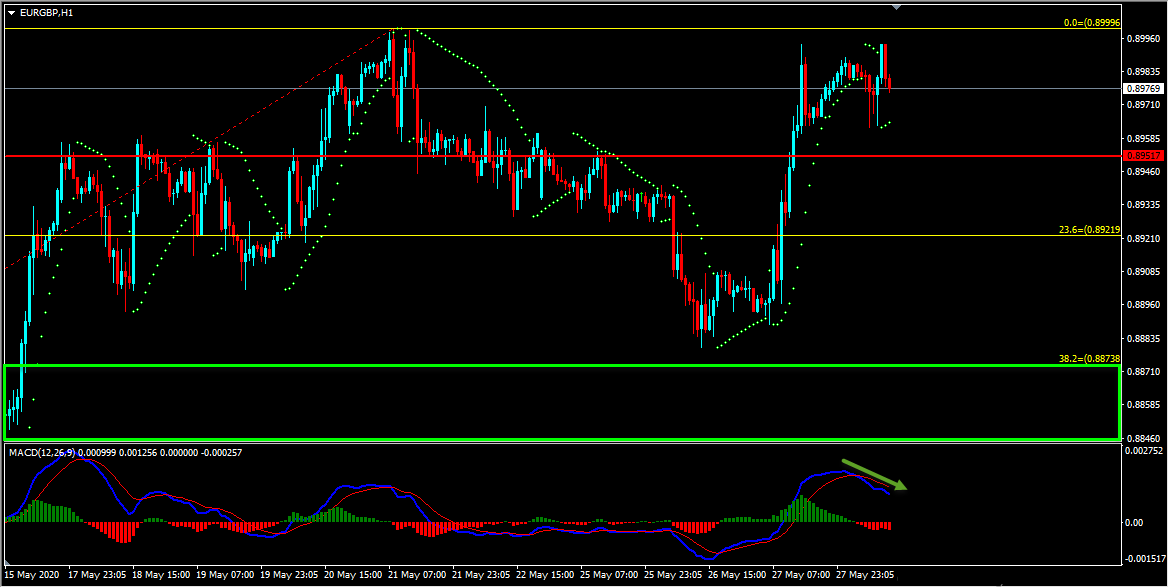
Based on the above-mentioned analysis my view was bullish here and the price which is moving higher is currently nearing the previous high. My view still remains the same here until the price holds above the key support zone but currently we have potential bearish divergence that is forming on both H4 and H1 charts, this is something that we definitely need to pay attention to. So if you are involved in the buys then this is a very important place to consider and manage your trade (cash out or partial cash out or trailing protections or partial hedge, etc.. depending on the strategy that you work with).
Note: If you want to learn about Money Management you can find it here
For similar trade ideas and much more join the Traders Academy Club and get access to our complete watch list and trade report.
This is how the report looks like. A table with the hottest market opportunities, screenshot behind every pair and time frame (anything that is in blue inside the table is clickable and leads to a screenshot) + a summary in text format, kind of highlights. And of course Live Trading Room every single day.
If you have any further questions, don’t hesitate to drop a comment below!
To your success,
Vladimir Ribakov
Certified Financial Technician
Hi Traders! USDCHF short term forecast update and follow up is here. On May 20th,…
Hi Traders! CADCHF short term forecast and technical analysis is here. We do our analysis…
The dollar was broadly steady on Monday as cautious investors watched out for signals on…
Hi Traders! Arvinth here from the Home Trader Club team. The weekly summary and, review of July…
European markets edged lower on Thursday following more overnight volatility in Asia’s tech-dominated indexes, while…
Hi Traders! EURGBP short term forecast and technical analysis is here. We do our analysis…