


Hi Traders!
We continue our “Ultimate Guide” series (see complete list of articles of the series below).
Today we are going to discuss the ADX Indicator which is favorite to so many traders and yet often overlooked.
There are many reasons why this indicator is absolutely amazing and if it fits your trading style, you should definitely give it a try but before we get to the reasons and the answers of the question “why” we should start from the beginning and cover the basics.
This is the full list of our “Ultimate Guide” articles. If you like them – give a thumb up and share on social media!
Commodity Channel Index (CCI) Indicator + Bonus Strategy
Stocks, Forex or Both?
Trading with Heikin Ashi Candles
Bollinger Bands Indicator Part 1
Bollinger Bands Indicator + Trading Methods Part 2
ADX Introduction
The Average Directional Index (ADX), Minus Directional Indicator (-DI) and Plus Directional Indicator (+DI) represent a group of directional movement indicators that form a trading system developed by Welles Wilder. Wilder designed ADX with commodities and daily prices in mind, but these indicators can also be applied to stocks.
The Average Directional Index (ADX) measures trend strength without regard to trend direction. The other two indicators, Plus Directional Indicator (+DI) and Minus Directional Indicator (-DI), complement ADX by defining trend direction.
Used together, chartists can determine both the direction and strength of the trend.
Wilder features the Directional Movement indicators in his 1978 book, New Concepts in Technical Trading Systems. This book also includes details on Average True Range (ATR), the Parabolic SAR system and RSI. Despite being developed before the computer age, Wilder’s indicators are incredible detailed in their calculation and have stood the test of time.
Directional Movement
Plus Directional Movement (+DM) and Minus Directional Movement (-DM) form the backbone of the Average Directional Index (ADX). Wilder determined directional movement by comparing the difference between two consecutive lows with the difference between the highs.
Directional movement is positive (plus) when the current high minus the prior high is greater than the prior low minus the current low. This so-called Plus Directional Movement (+DM) then equals the current high minus the prior high, provided it is positive. A negative value would simply be entered as zero.
Directional movement is negative (minus) when the prior low minus the current low is greater than the current high minus the prior high. This so-called Minus Directional Movement (-DM) equals the prior low minus the current low, provided it is positive. A negative value would simply be entered as zero.
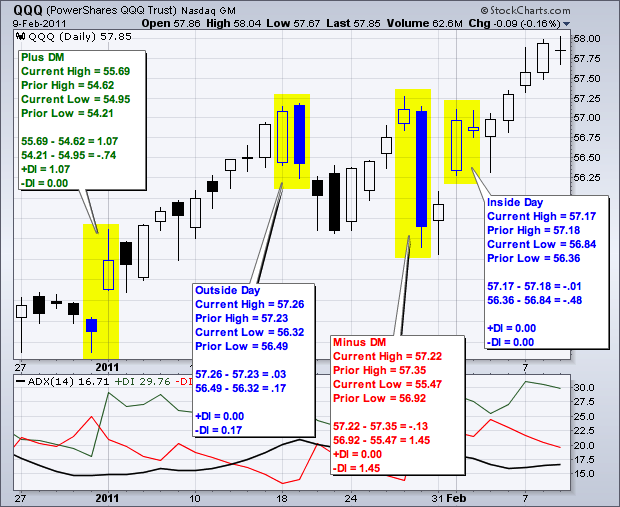
The chart above shows four calculation examples for directional movement.
The first pairing shows a big positive difference between the highs for a strong Plus Directional Movement (+DM).
The second pairing shows an outside day with Minus Directional Movement (-DM) getting the edge.
The third pairing shows a big difference between the lows for a strong Minus Directional Movement (-DM).
The final pairing shows an inside day, which amounts to no directional movement (zero).
Both Plus Directional Movement (+DM) and Minus Directional Movement (-DM) are negative and cancel out each other. Negative values revert to zero. All inside days will have zero directional movement.
ADX Formula and Calculation
To calculate +DI and −DI, one needs price data consisting of high, low, and closing prices each period (typically each day). One first calculates the directional movement (+DM and −DM):
- UpMove = today’s high − yesterday’s high
- DownMove = yesterday’s low − today’s low
- if UpMove > DownMove and UpMove > 0, then +DM = UpMove, else +DM = 0
- if DownMove > UpMove and DownMove > 0, then −DM = DownMove, else −DM = 0
After selecting the number of periods (Wilder used 14 days originally), +DI and −DI are:
- +DI = 100 times the smoothed moving average of (+DM) divided by average true range
- −DI = 100 times the smoothed moving average of (−DM) divided by average true range
The smoothed moving average is calculated over the number of periods selected, and the average true range is a smoothed average of the true ranges. Then:
- A.D.X. = 100 times the smoothed moving average of the absolute value of (+DI − −DI) divided by (+DI + −DI)
Variations of this calculation typically involve using different types of moving averages, such as an exponential moving average, a weighted moving average or an adaptive moving average.
Wilder’s Smoothing
As seen in the ADX calculation, there is a lot of smoothing involved and it is important to understand the effects. Because of Wilder’s smoothing techniques, it can take around 150 periods of data to get true ADX values.
Wilder uses similar smoothing techniques with his RSI and Average True Range calculations. ADX values using only 30 periods of historical data will not match ADX values using 150 periods of historical data. ADX values with 150 days or more of data will remain consistent.
The first technique is used to smooth each period’s +DM1, -DM1 and TR1 values over 14 periods. As with an exponential moving average, the calculation has to start somewhere so the first value is simply the sum of the first 14 periods. As shown below, smoothing starts with the second 14-period calculation and continues throughout.
First TR14 = Sum of first 14 periods of TR1 Second TR14 = First TR14 - (First TR14/14) + Current TR1 Subsequent Values = Prior TR14 - (Prior TR14/14) + Current TR1
The second technique is used to smooth each period’s DX value to finish with the Average Directional Index (ADX). First, calculate an average for the first 14 days as a starting point. The second and subsequent calculations use the smoothing technique below:
First ADX14 = 14 period Average of DX Second ADX14 = ((First ADX14 x 13) + Current DX Value)/14 Subsequent ADX14 = ((Prior ADX14 x 13) + Current DX Value)/14
Interpretation
The Average Directional Index (ADX) is used to measure the strength or weakness of a trend, not the actual direction. Directional movement is defined by +DI and -DI. In general, the bulls have the edge when +DI is greater than – DI, while the bears have the edge when – DI is greater. Crosses of these directional indicators can be combined with ADX for a complete trading system.
Before looking at some signals with examples, keep in mind that Wilder was a commodity and currency trader. The examples in his books are based on these instruments, not stocks. This does not mean his indicators cannot be used with stocks.
Some stocks have price characteristics similar to commodities, which tend to be more volatile with short and strong trends. Stocks with low volatility may not generate signals based on Wilder’s parameters. Chartists will likely need to adjust the indicator settings or the signal parameters according to the characteristics of the security.
Trend Strength
At its most basic the Average Directional Index (ADX) can be used to determine if a security is trending or not. This determination helps traders choose between a trend following system or a non-trend following system. Wilder suggests that a strong trend is present when ADX is above 25 and no trend is present when below 20. There appears to be a gray zone between 20 and 25. As noted above, chartists may need to adjust the settings to increase sensitivity and signals. ADX also has a fair amount of lag because of all the smoothing techniques. Many technical analysts use 20 as the key level for ADX.
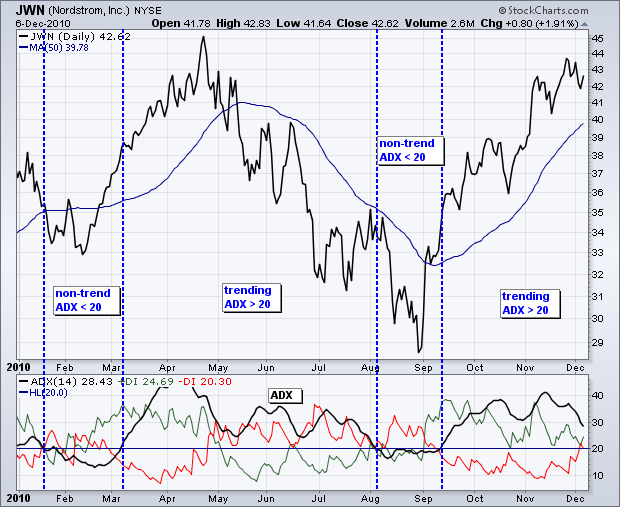
The chart above shows Nordstrom (JWN) with the 50-day SMA and 14-day Average Directional Index (ADX). The stock moved from a strong uptrend to a strong downtrend in April-May, but ADX remained above 20 because the strong uptrend quickly changed into a strong downtrend. There were two non-trending periods as the stock formed a bottom in February and August. A strong trend emerged after the August bottom as ADX moved above 20 and remained above 20.
DI Crossover System
Wilder put forth a simple system for trading with these directional movement indicators. The first requirement is for ADX to be trading above 25. This ensures that prices are trending. Many traders, however, use 20 as the key level. A buy signal occurs when +DI crosses above – DI. Wilder based the initial stop on the low of the signal day.
The signal remains in force as long as this low holds, even if +DI crosses back below – DI. Wait for this low to be penetrated before abandoning the signal. This bullish signal is reinforced if/when ADX turns up and the trend strengthens. Once the trend develops and becomes profitable, traders will have to incorporate a stop-loss and trailing stop should the trend continue. A sell signal triggers when – DI crosses above +DI. The high on the day of the sell signal becomes the initial stop-loss.
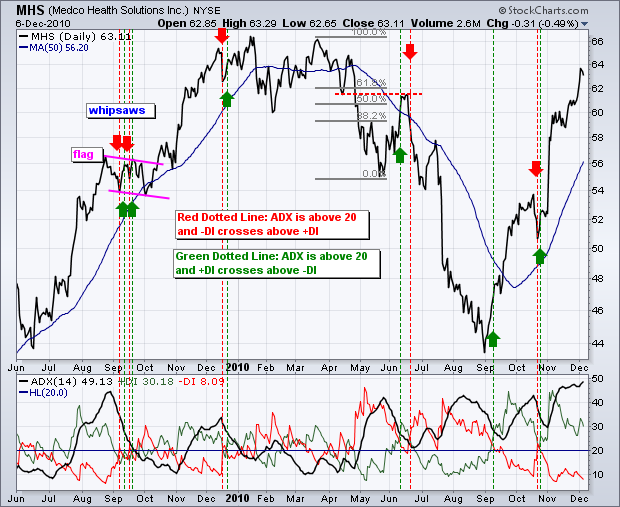
The chart above shows Medco Health Solutions with the three directional movement indicators. Note that 20 is used instead of 25 to qualify ADX signals. A lower setting means more possible signals. The green dotted lines show the buy signals and the red dotted lines show the sell signals. Wilders initial stops were not incorporated in order to focus on the indicator signals.
As the chart clearly shows, there are plenty of +DI and – DI crosses. Some occur with ADX above 20 validate signals. Others occur to invalidate signals. As with most such systems, there will be whipsaws, great signals and bad signals. The key, as always, is to incorporate other aspects of technical analysis. For example, the first group of whipsaws in September 2009 occurred during a consolidation.
Moreover, this consolidation looked like a flag, which is a bullish consolidation that forms after an advance. It would have been prudent to ignore bearish signals with a bullish continuation pattern taking shape. The June 2010 buy signal occurred near a resistance zone marked by broken support and the 50-62% retracement zone. It would have been prudent to ignore a buy signal so close to this resistance zone.
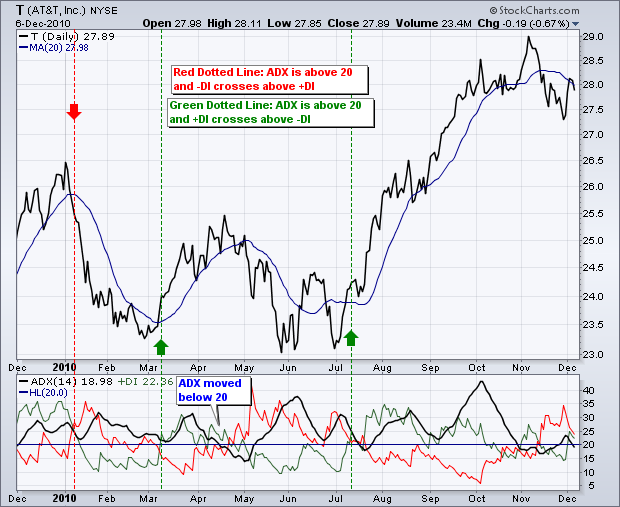
The chart above shows AT&T (T) with three signals over a 12 month period. These three signals were pretty good, provided profits were taken and trailing stops were used. Wilders Parabolic SAR could have been used to set a trailing stop-loss. Notice that there was no sell signal between the March and July buy signals. This is because ADX was not above 20 when -DI crossed above +DI in late April.
Conclusions
The directional movement indicator calculations are complex, interpretation is straight-forward and successful implementation takes practice. +DI and – DI crossovers are quite frequent and chartists need to filter these signals with complementary analysis.
Setting an ADX requirement will reduce signals, but this uber-smoothed indicator tends to filter as many good signals as bad. In other words, chartists might consider moving ADX to the back burner and focusing on the Directional Indicators to generate signals.
These crossover signals will be similar to those generated using momentum oscillators.
Therefore, chartists need to look elsewhere for confirmation help. Volume-based indicators, basic trend analysis and chart patterns can help distinguish strong crossover signals from weak crossover signals. For example, chartists can focus on +DI buy signals when the bigger trend is up and – DI sell signals when the bigger trend is down.
Sources and References: Wikipedia | Stockcharts


