The British Pound is enjoying a monster bull run against the Canadian Dollar, as the latter one struggled recently against a basket of currencies. There is a possibility that a wave duplication pattern is forming on the weekly chart of GBPCAD, which can be seen as a target of buyers, and where we might look for sell opportunities. Until then, every minor correction from the current levels could be seen as a buying opportunity.
Looking at the hourly chart, there is a chance of one more wave duplication pattern. So, if the price corrects a few pips lower from the current levels we can enter a buy trade.
Technical Analysis
W1 – Possibility of the pair completing the highlighted wave duplication pattern.
Entry:
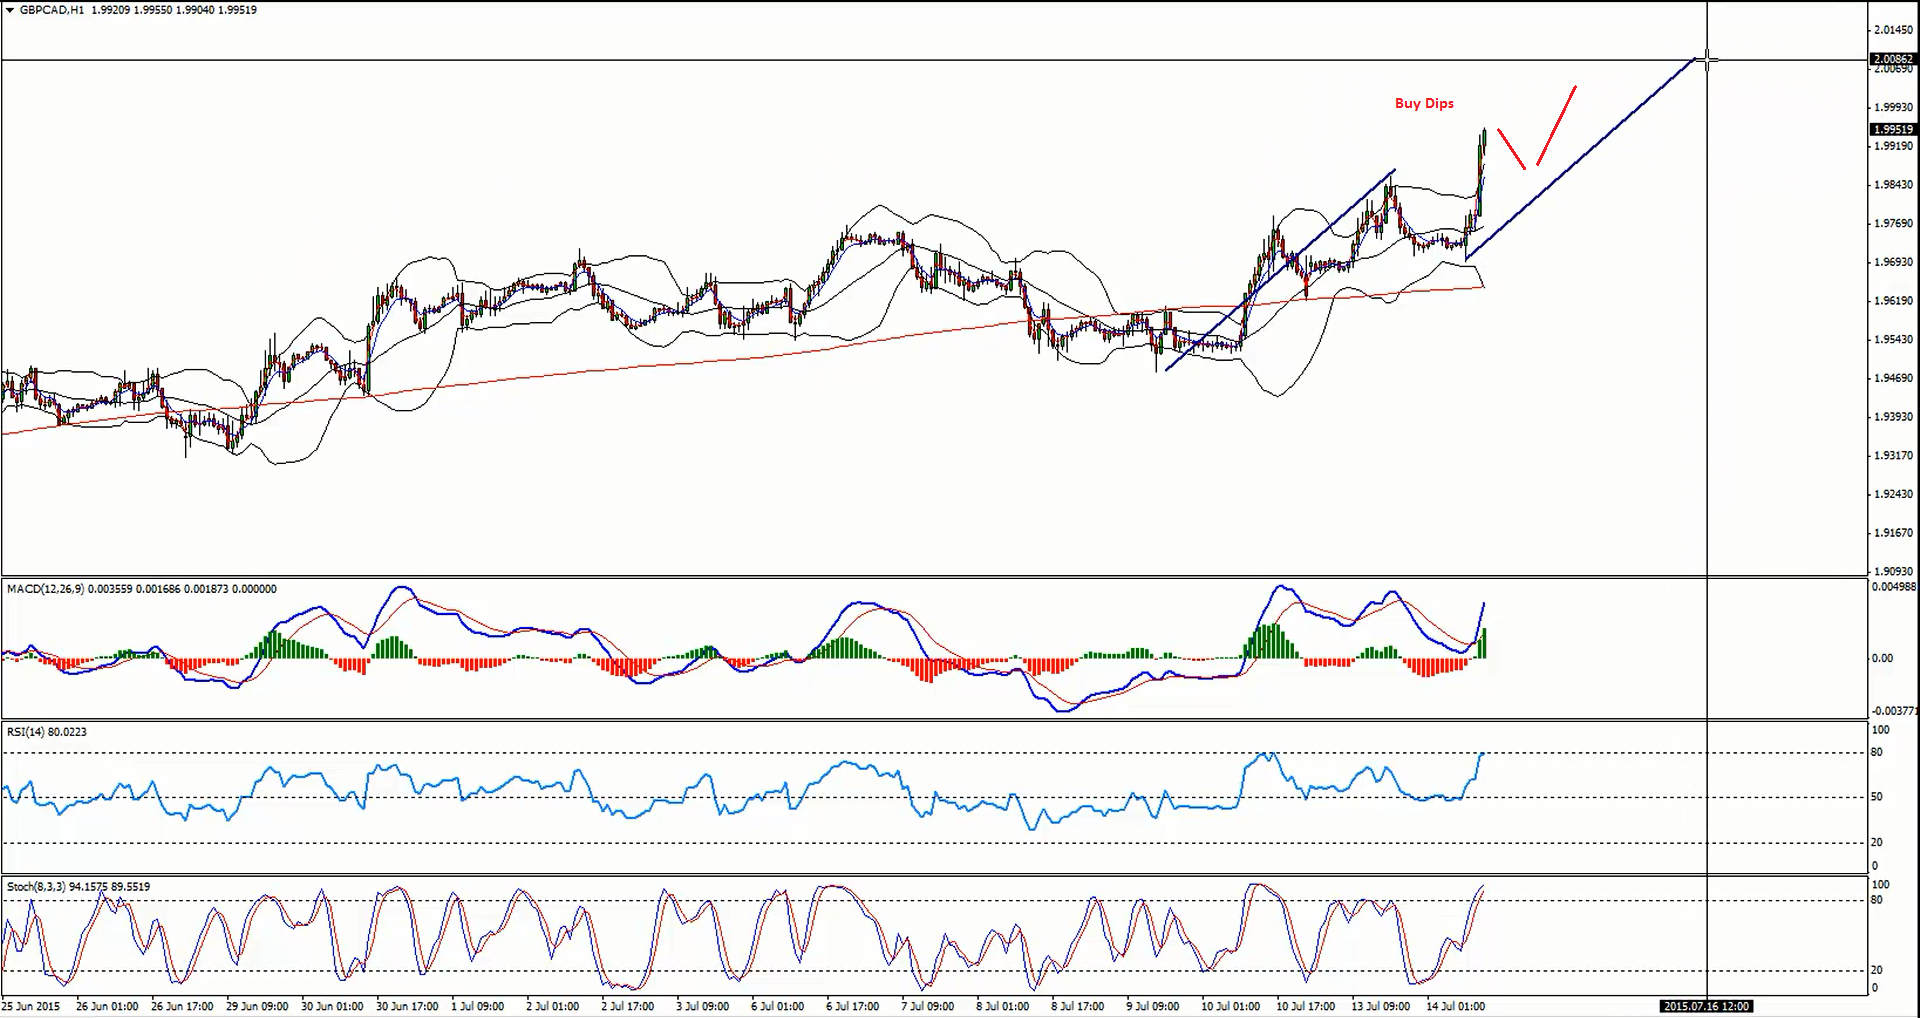
H1– We can enter a Buy trade if the price corrects a few pips from the current levels and forms a bullish divergence. Our target would be around the wave duplication area as highlighted in the chart.
Target 1: 1.9950
Target 2: 2.0000
Stop Loss: Below the last low created before entering the trade.
Video Explanation:
Hi Traders! EURNZD short term forecast and technical analysis is here. We do our analysis…
Hi Traders! AUDCAD short term forecast update and follow up is here. On May 12st…
Hi Traders! Dax short term forecast and technical analysis is here. We do our analysis…
The first week of July has already delivered significant volatility across the financial markets. Following…
Hi Traders! Arvinth here from the Home Trader Club team. The weekly summary and, review of July…
Wall Street's main indexes rose on Thursday as a softer-than-expected employment report for June tempered…