GOLD continued to struggle this past week, and it is likely to remain under bearish pressure in the short term. The weekly chart of GOLD is suggesting more downsides, and so is the daily chart. Looking at the 4-hours chart, there is a chance that the price might complete a wave duplication pattern. So, I think looking for short-term sell opportunities might be a good deal moving ahead.
If the price corrects a few pips from the current levels, then we can look to enter a sell once a bearish divergence is formed on the lower timeframe.
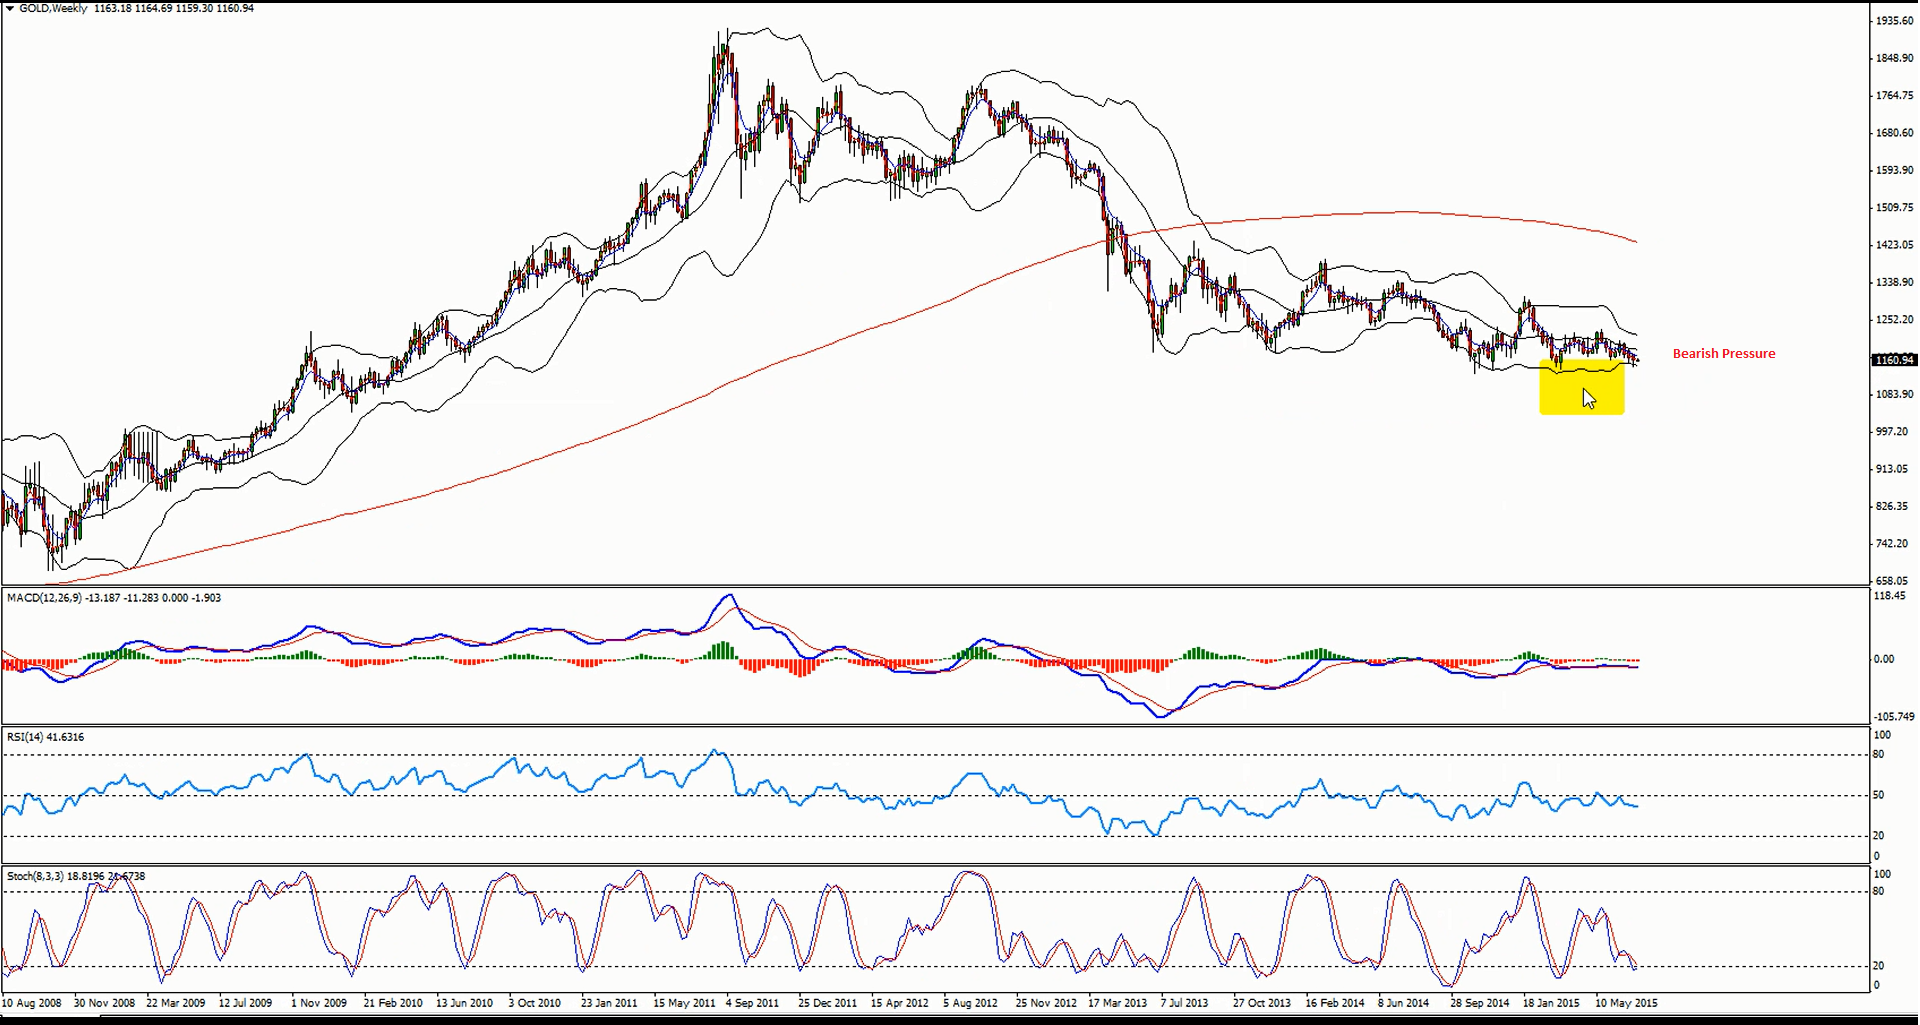
Technical Analysis
W1– Chart highlights the amount of bearish pressure on GOLD.
H4 – There is a possibility that the price might complete the highlighted wave duplication pattern.
Entry:
H4– We can enter a sell trade if the price corrects a few pips from the current levels and forms a bearish divergence on the lower timeframe.
Target 1: $1145
Target 2: $1135
Stop Loss: Above the last high created before entering the trade.
Video Analysis:
Hi Traders! EURNZD short term forecast and technical analysis is here. We do our analysis…
Hi Traders! AUDCAD short term forecast update and follow up is here. On May 12st…
Hi Traders! Dax short term forecast and technical analysis is here. We do our analysis…
The first week of July has already delivered significant volatility across the financial markets. Following…
Hi Traders! Arvinth here from the Home Trader Club team. The weekly summary and, review of July…
Wall Street's main indexes rose on Thursday as a softer-than-expected employment report for June tempered…