Hi Traders! GBPCHF short term forecast follow-up and update is here. On July 8th, 2024 I shared this “GBPCHF Technical Analysis And Short Term Forecast” post in our blog. In this post, let’s do a recap of this setup and see how it has developed now. If you would like to learn more about the way we trade and the technical analysis we use then check out the Home Trader Club. Spoiler alert – free memberships are available!
As an Internationally Certified Financial Technician (CFTe, IFTA) and former private capital hedge fund trader, I have successfully mentored numerous students who are now thriving in the trading world. Students who learned with me, are now full-time traders, work in the trading industry, run their own capital firms or are fully funded traders by private companies, develop automated trading solutions and manage others’ capitals. I am a very proud mentor and I am proud of the success stories I’ve helped create, and for a limited time, I’m offering my mentorship program for free through a partnership with Eight Cap broker. Join Eight Cap, become an active trader, and choose the offer that suits you best –
For more details, visit: Home Trader Club Mentorship Program
I’m excited to work with you and help you reach your desired level of success!
My Idea
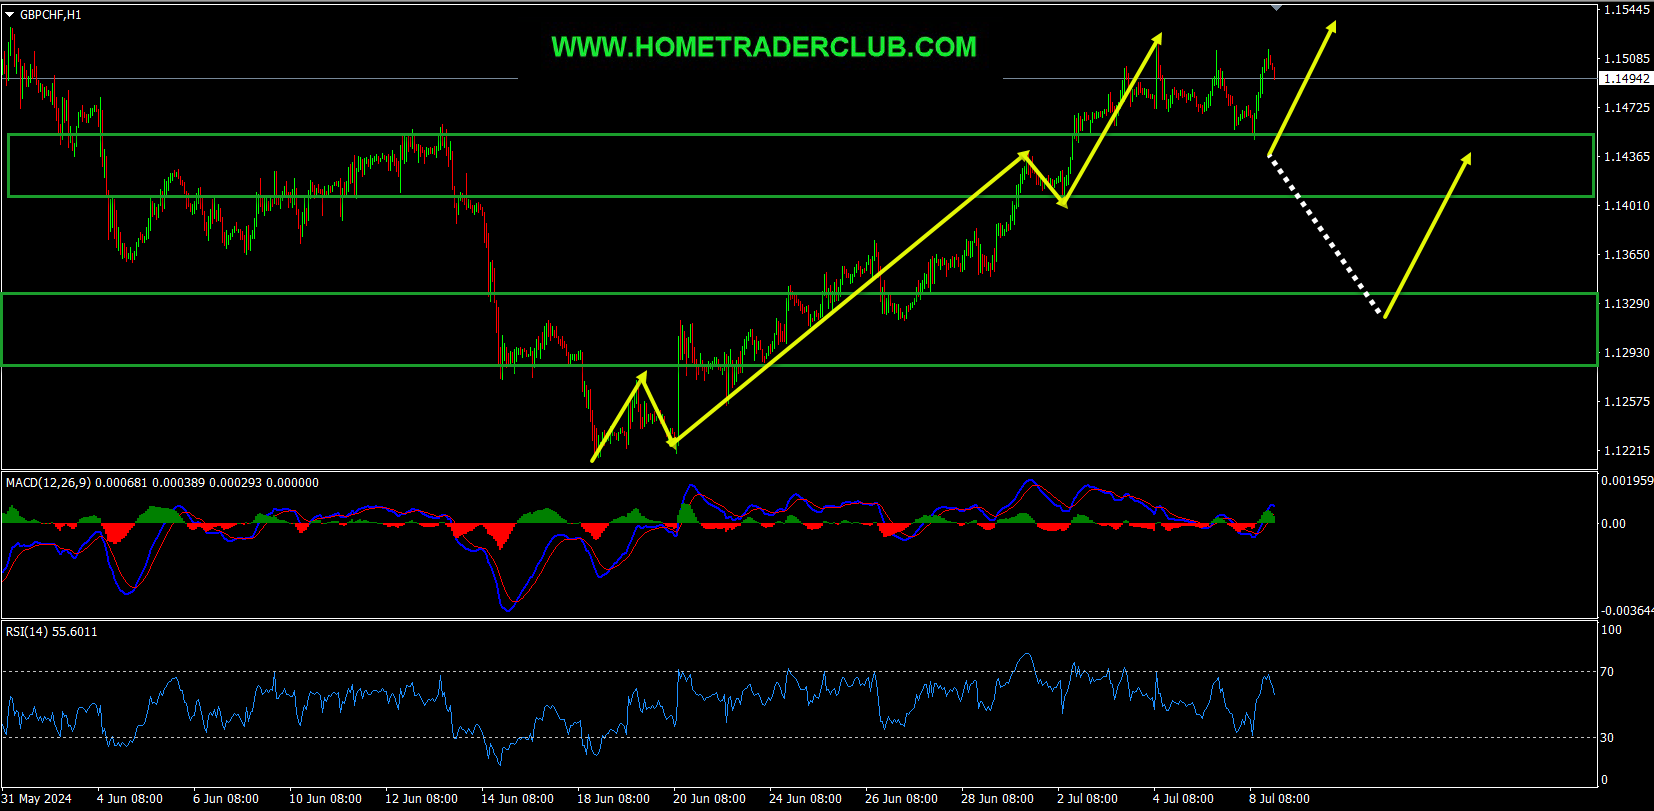
On the H1 chart, based on the Heikin Ashi candles we can see that currently, we have strong bullish bodies in upward moving market conditions so it basically reflects a bullish environment. Also, the price which is moving higher has created a bullish trend pattern in the form of three higher highs, higher lows, we may consider this as another evidence of bullish pressure. Generally, after a bullish trend pattern, we may expect corrections and then potential continuation higher. Currently, it looks like a correction is happening. In addition to this, we had two strong resistance zones that has formed and the price which was moving higher has broken above these zones and is holding above them. After the breakout these strong resistance zones are acting as two strong support zones for us. Until both these strong support zones shown in the image below (marked in green) holds my short term view remains bullish here and I expect the price to move higher further after pullbacks.
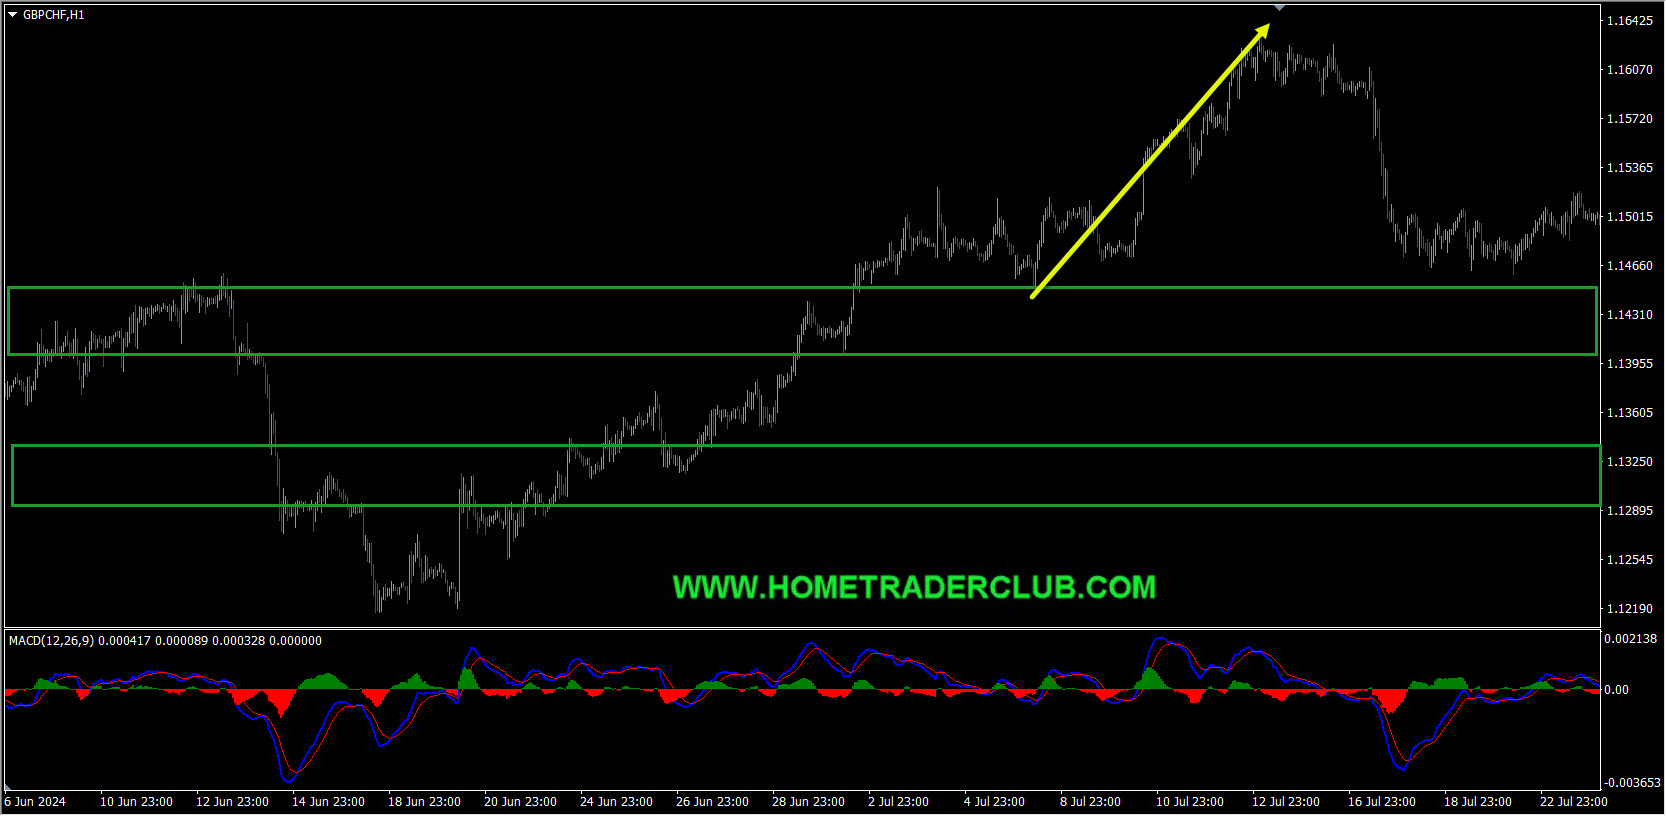
In this pair, based on my technical analysis I mentioned that “Until both these strong support zones shown in the image below (marked in green) holds my short term view remains bullish here and I expect the price to move higher further after pullbacks”. The price action followed my analysis exactly as I expected it to here. The price which was moving lower respected the first strong support zone and then it bounced higher from this zone. The price then moved higher further and delivered around 170+ pips move!
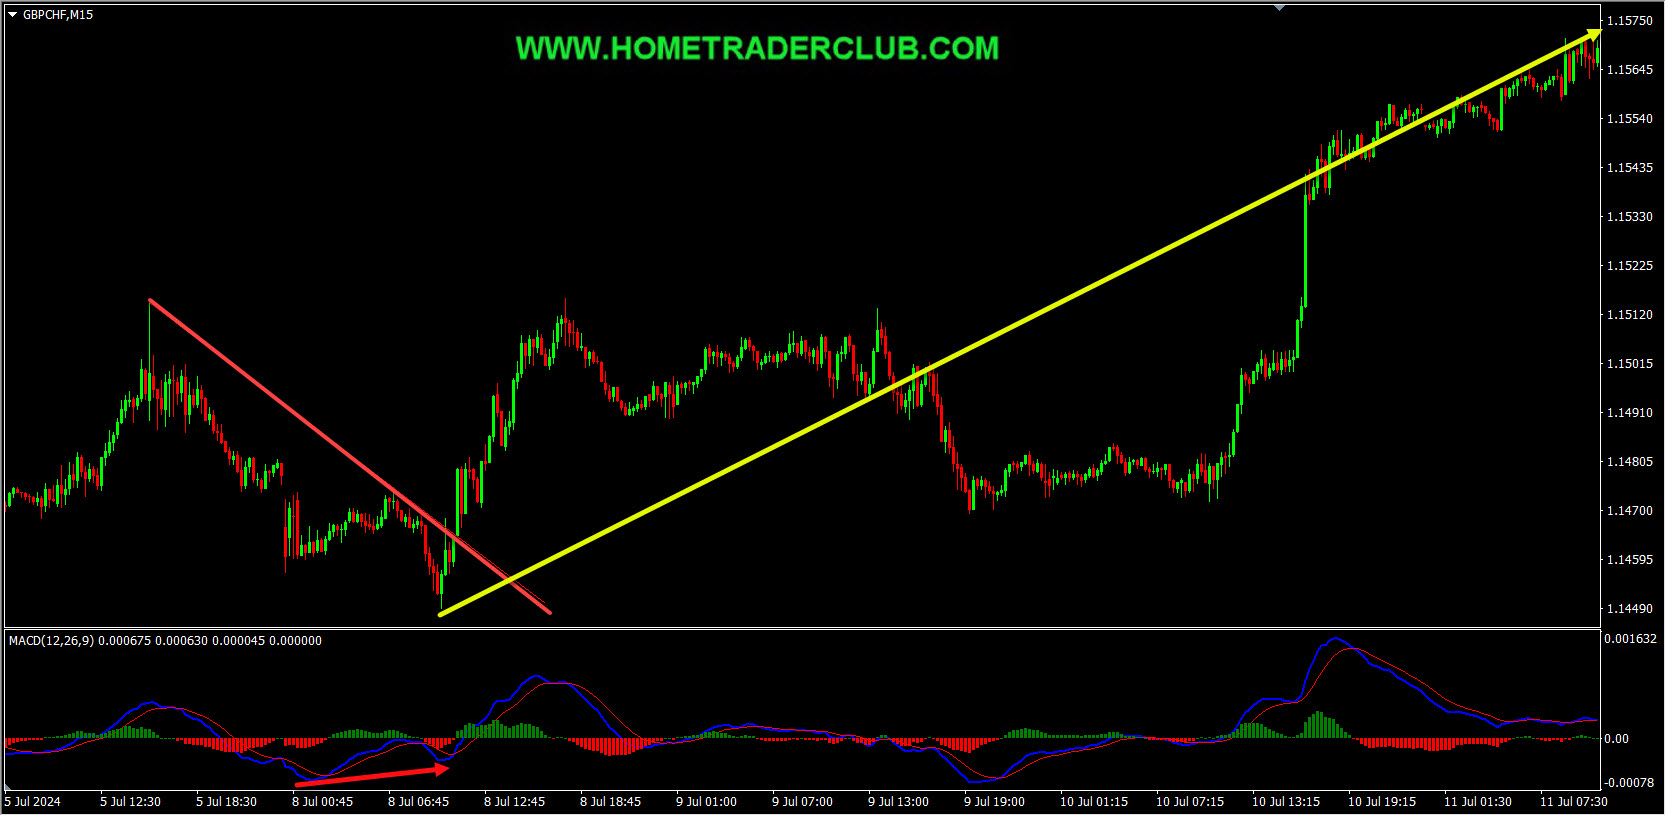
On the M15 chart, the market provided us with various facts supporting the bullish view. The price which was moving lower created a bullish divergence between the first low that has formed at 1.14595 and the second low that has formed at 1.14489 based on the MACD indicator. The price then moved higher and broke above the most recent downtrend line, we may consider these as facts provided by the market supporting the bullish view. Then as you can see in the image below how the price moved higher after that and provided an amazing move to the upside!
So, traders, this is why I wanted to show this example to help you understand how important it is to follow the facts. The facts were supporting the bullish view here and there were no signs against it. When the facts do happen as we expected you can see how the price perfectly moved as per the plan. Because these are the kind of hints the market provides us with the majority of the time and it’s our obligation as traders to be able to listen to these things that the market tells us and we should try to make the right actions accordingly.
For similar trade ideas and much more I invite you to
Also, you can get one of our strategies free of charge. You will find all the details here
Download our best forex indicators here
If you have any further questions, don’t hesitate to drop a comment below!
Happy Trading!
Arvinth Akash
Home Trader Club Team.
Hi Traders! NZDUSD short term forecast and technical analysis is here. We do our analysis…
We are pleased to officially announce our new partnership with AvaTrade, one of the most…
Hi Traders! EURUSD short term forecast and technical analysis is here. We do our analysis…
Welcome to this week’s Forex forecast. In this analysis, we break down the key technical…
Hi Traders! Arvinth here from the Home Trader Club team. The weekly summary and, review of April…
Stocks and bonds fell as oil surged anew, with President Donald Trump dashing optimism that the war in…