Hi Traders! GBPCHF short term forecast follow up and update is here. On December 7th I shared this “GBPCHF Short Term Forecast And Technical Analysis” post in our blog. In this post, let’s do a recap of this setup and see how it has developed now. If you would like to learn more about the way we trade and the technical analysis we use then check out the Traders Academy Club. Spoiler alert – free memberships are available!
My Idea
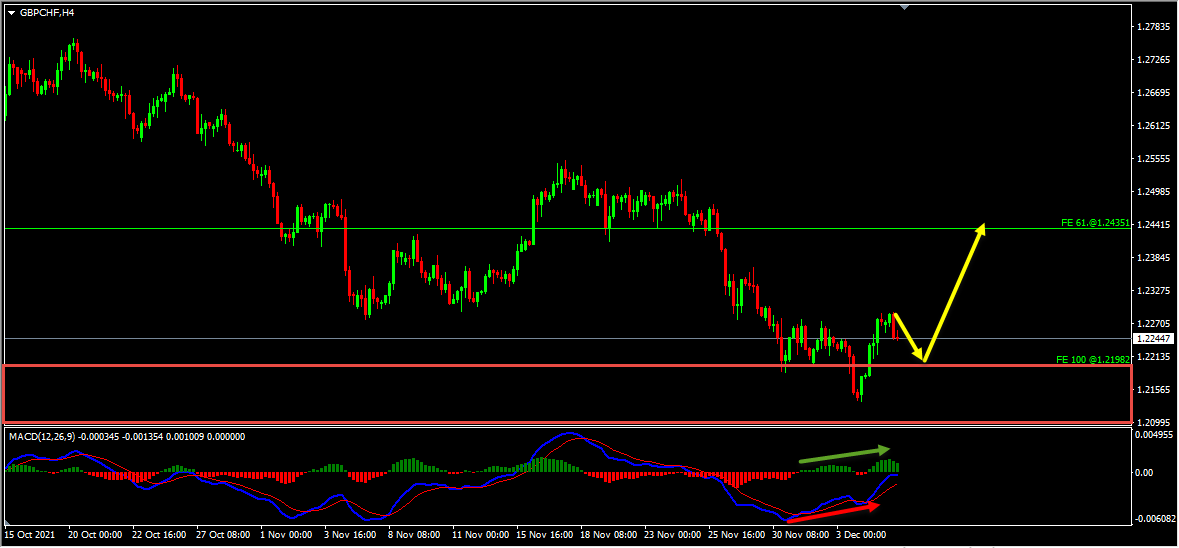
On the H4 chart, we had a bullish divergence that has formed between the first low that has formed at 1.21869 and the second low that has formed at 1.21360 based on the MACD indicator. Then the price moved higher and broke above the last high at 1.22733 creating higher highs, thus forming a classical setup of bullish divergence followed by bullish convergence. Hence as per the book scenario, after a bullish convergence, we may look for corrections to happen and then further continuation to the upside. Currently it looks like a correction is happening. Until the strong support zone (marked in red) shown in the image below holds my short term view remains bullish here and I expect the price to move higher further after pullbacks.
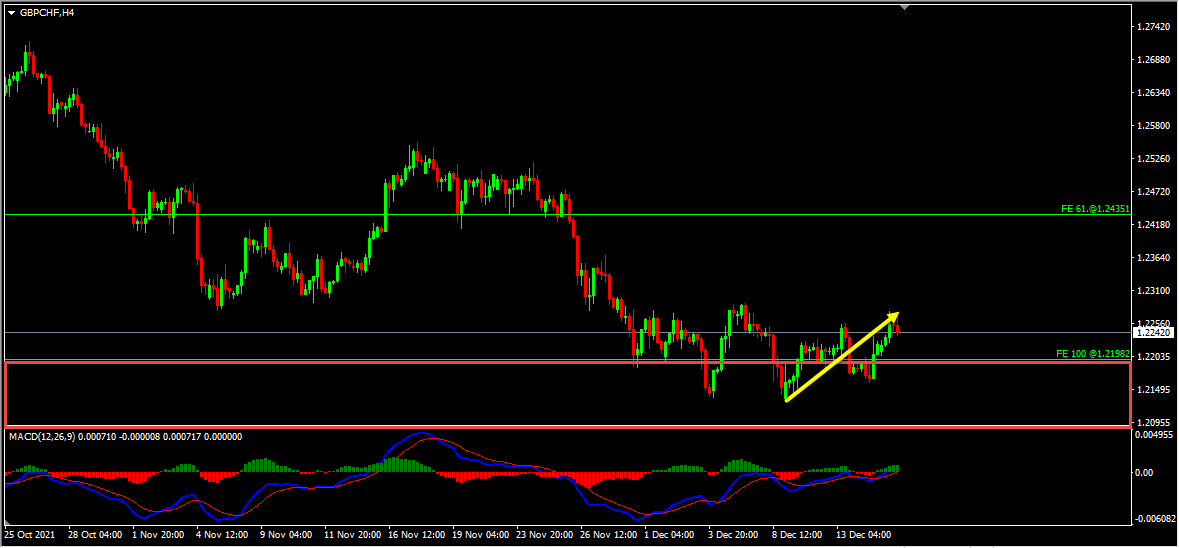
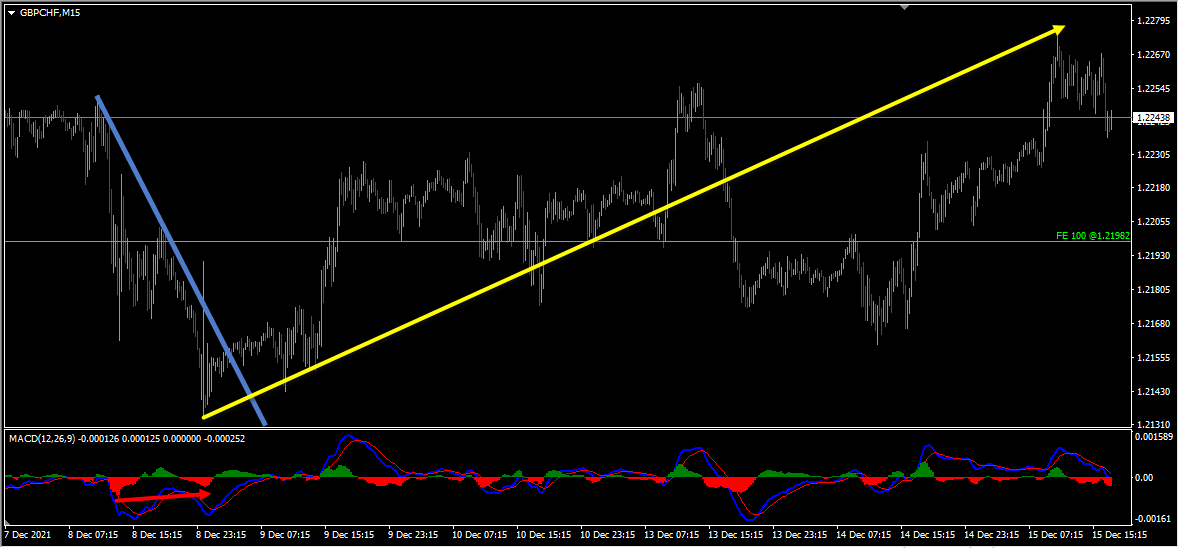
In this pair based on the above-mentioned analysis, until the strong support zone holds my short term view was bullish and I was expecting the price to move higher further after pullbacks. We had deeper pullback here with the price reaching the strong support zone again creating a new low. In addition to this, the price also created a bullish divergence between the first low that has formed at 1.21360 and the second low that has formed at 1.21336 based on the MACD indicator. We may consider this as evidence of bullish pressure. The price respected the strong support zone and then it moved higher delivering around 150 pips move so far.
(Note: You can learn about a Killer Forex Strategy “Double Trend Line Principle” here)
For similar trade ideas and much more I invite you to
Also, you can get one of our strategies free of charge. You will find all the details here
If you have any further questions, don’t hesitate to drop a comment below!
Happy Trading!
Arvinth Akash
Traders Academy Club Team.
Hi Traders! Gold short term forecast update and follow up is here. On February 5th,…
Hi Traders! Dax short term forecast and technical analysis is here. We do our analysis…
Hi Traders! NZDUSD short term forecast and technical analysis is here. We do our analysis…
We are pleased to officially announce our new partnership with AvaTrade, one of the most…
Hi Traders! EURUSD short term forecast and technical analysis is here. We do our analysis…
Welcome to this week’s Forex forecast. In this analysis, we break down the key technical…