Hi Traders! GBPCHF short term forecast follow-up and update is here. On January 21st, 2026 I shared this “Forex Market Analysis & Day Trading Opportunity | GBPCHF | 21 January 2026” post in our blog. In this post, let’s do a recap of this setup and see how it has developed now. If you would like to learn more about the way we trade and the technical analysis we use then check out the Home Trader Club. Spoiler alert – free memberships are available!
As an Internationally Certified Financial Technician (CFTe, IFTA) and former private capital hedge fund trader, I have successfully mentored numerous students who are now thriving in the trading world. Students who learned with me, are now full-time traders, work in the trading industry, run their own capital firms or are fully funded traders by private companies, develop automated trading solutions and manage others’ capitals. I am a very proud mentor and I am proud of the success stories I’ve helped create, and for a limited time, I’m offering my mentorship program for free through a partnership with Eight Cap broker. Join Eight Cap, become an active trader, and choose the offer that suits you best –
For more details, visit: Home Trader Club Mentorship Program
I’m excited to work with you and help you reach your desired level of success!
My Idea
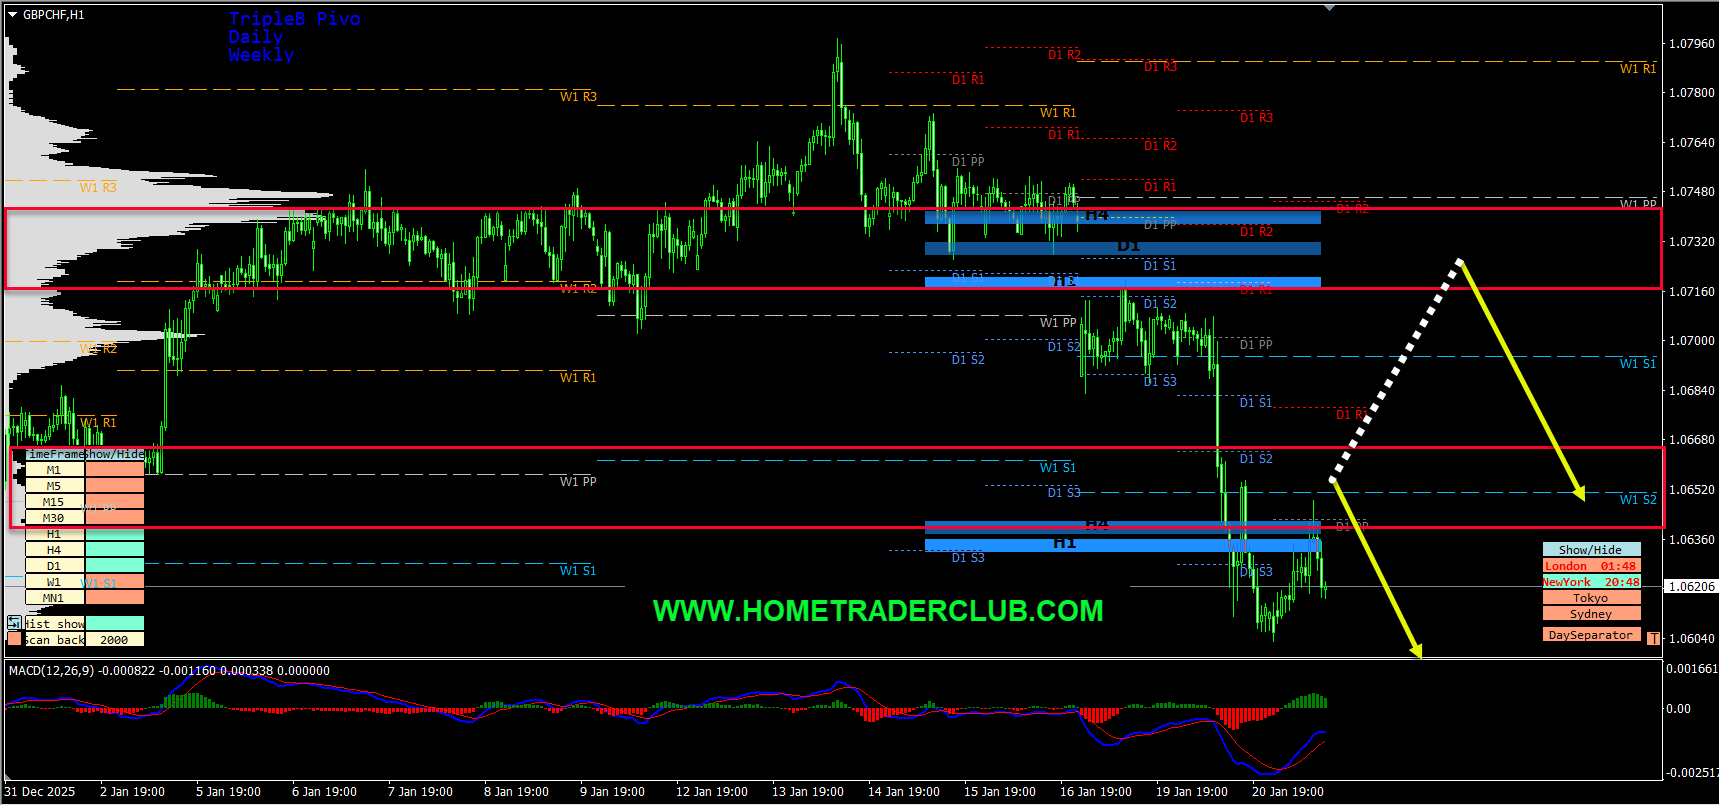
On the H1 chart, we have a strong bearish momentum and also currently there are no signs opposing this short term bearish view. So everything looks good for the bears here as well. In addition to this, we have two key resistance zones that has formed based on the volume profile zones of the KTLI indicator and the Triple B Pro pivot levels. Until both these key resistance zones shown in the image below (marked in yellow) holds my short term view remains bearish here and I expect the price to move lower further after retraces.
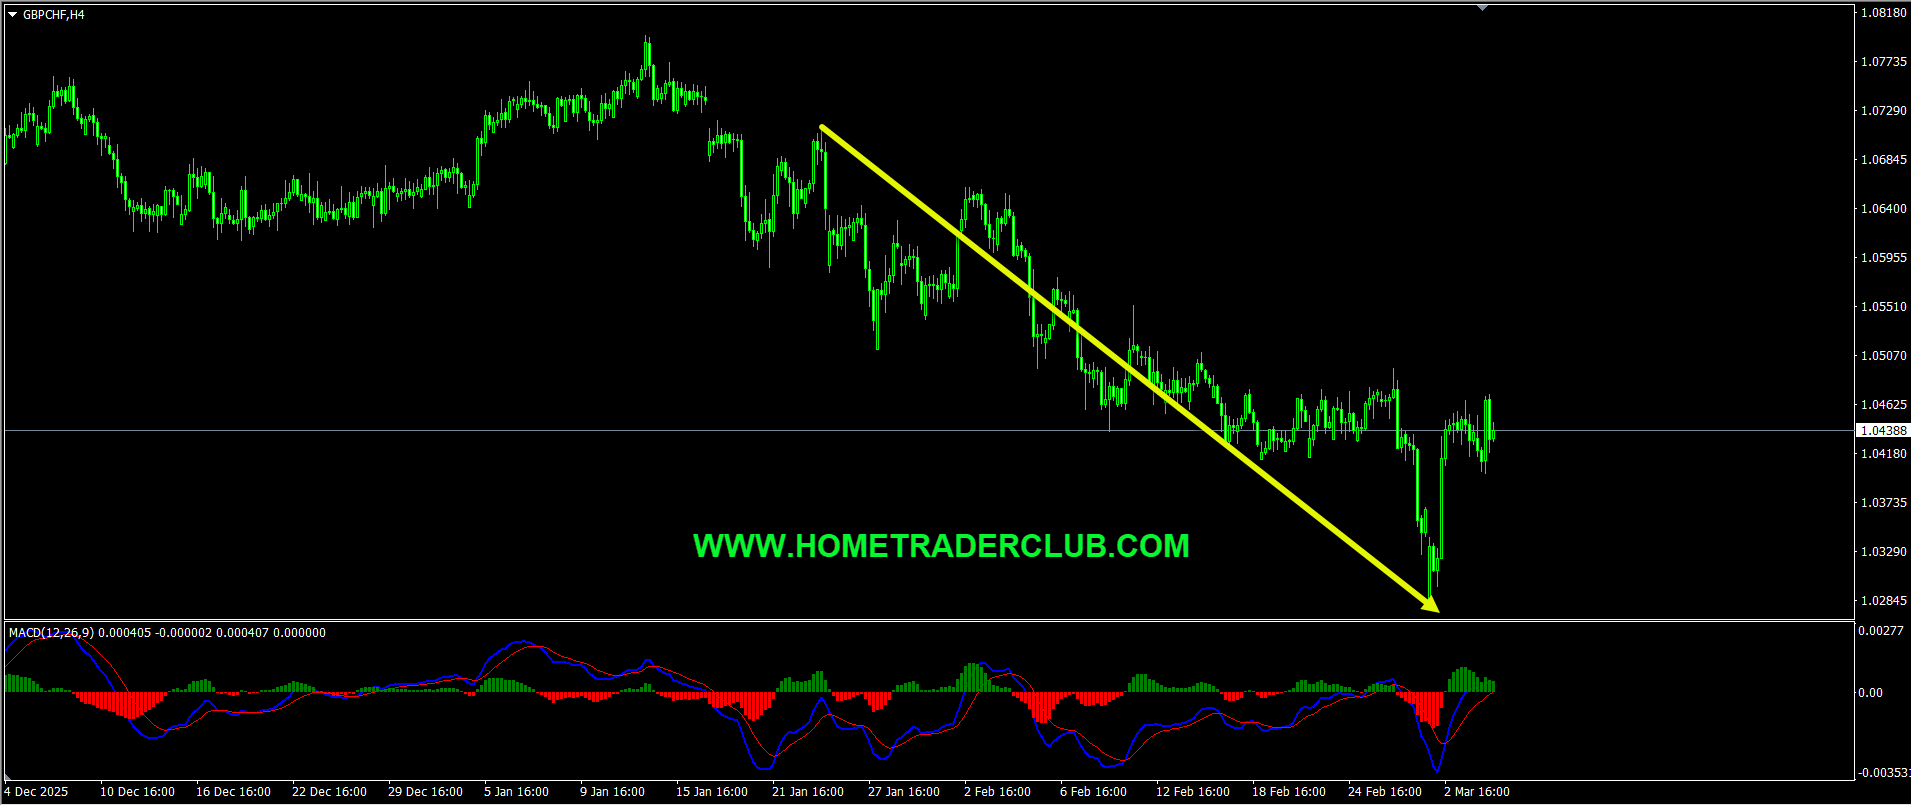
You can see this move clearly on the H4 chart below.
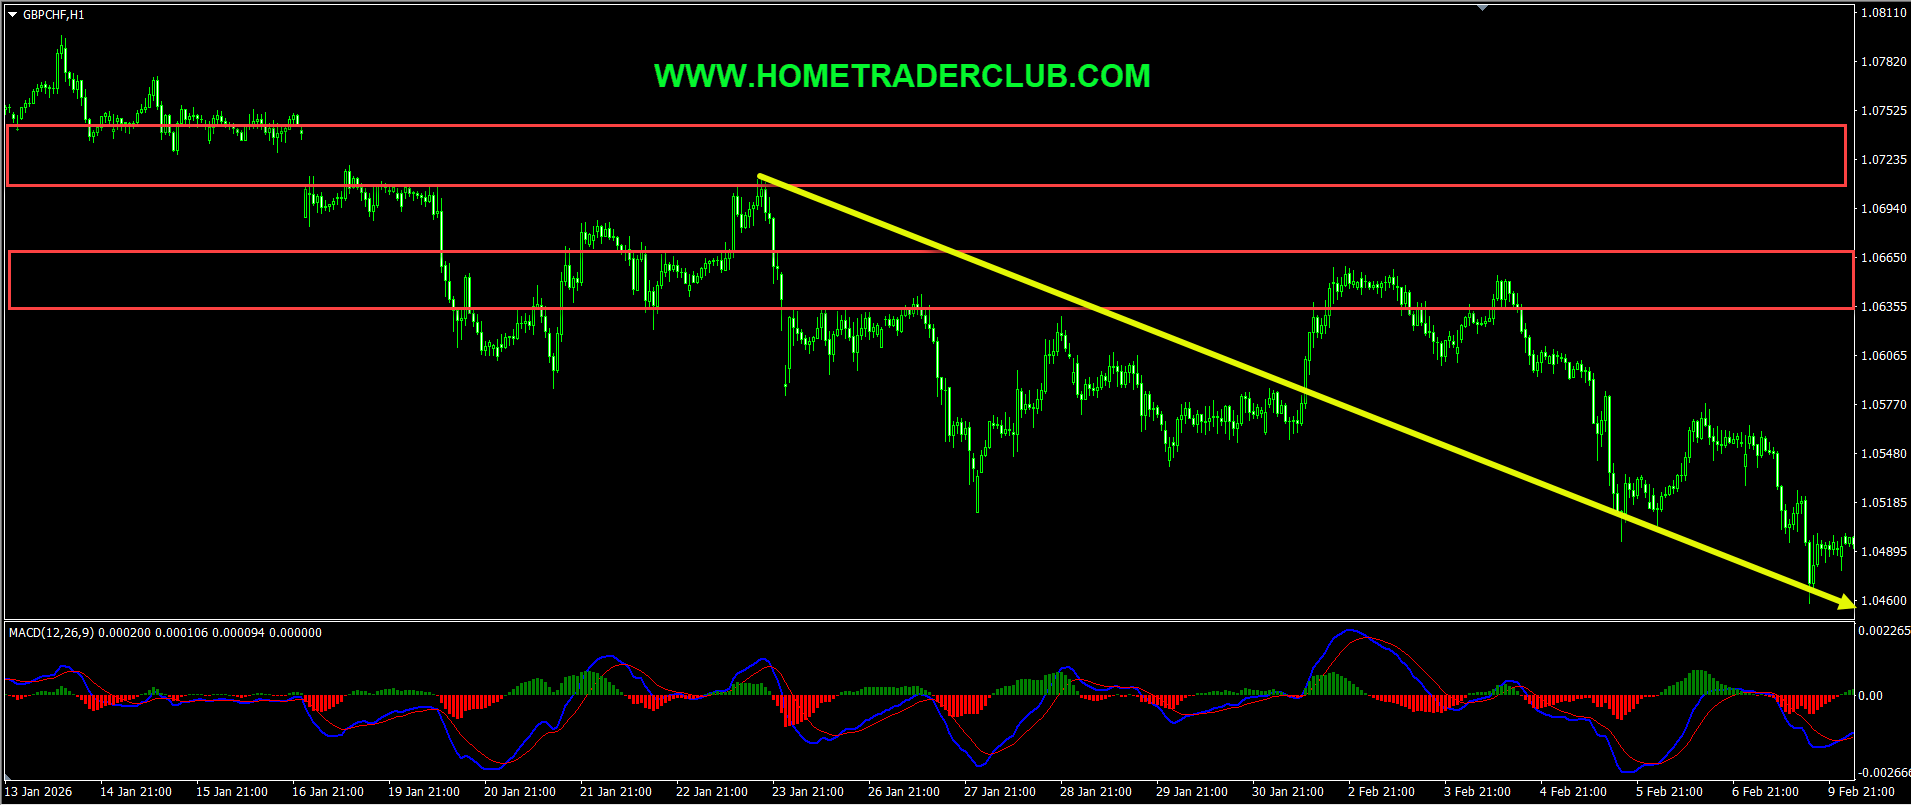
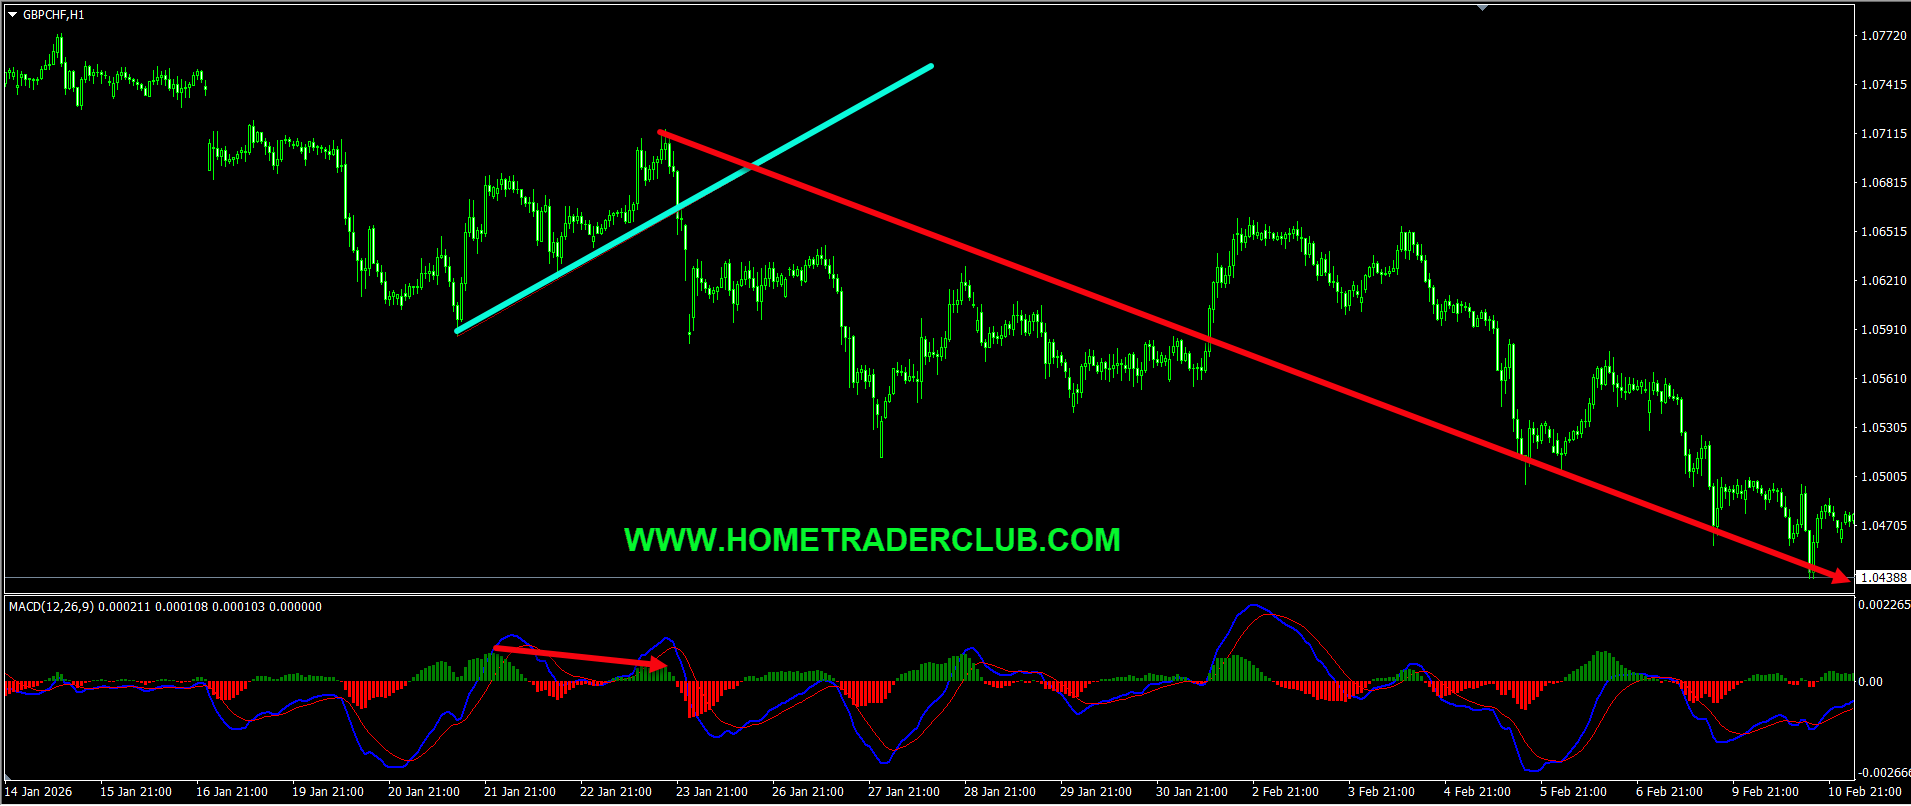
On the H1 chart, the market provided us with various facts supporting the bearish view. The price which was moving higher created a bearish divergence between the first high that has formed at 1.06871 and the second high that has formed at 1.07140 based on the MACD indicator, which we may consider as evidence of bearish pressure. The price then moved lower and broke below the most recent uptrend line. We may consider these as facts provided by the market supporting the bearish view and also there we no signs opposing this bearish view. Then as you can see in the image below how the price moved lower further and provided a wonderful move to the downside.
So, traders, this is why I wanted to show this example to help you understand how important it is to follow the facts. The facts were supporting the bearish view here and there were no signs against it. When the facts do happen as we expected you can see how the price perfectly moved as per the plan. Because these are the kind of hints the market provides us at the majority of the time and it’s our obligation as traders to be able to listen to these things that the market tells us and we should try to make the right actions accordingly.
For similar trade ideas and much more I invite you to
Also, you can get one of our strategies free of charge. You will find all the details here
Download our best forex indicators here
If you have any further questions, don’t hesitate to drop a comment below!
Happy Trading!
Arvinth Akash
Home Trader Club Team.
Europe’s bonds will struggle to bounce back from a sharp selloff triggered by the war…
Hi Traders! GBPUSD short term forecast and technical analysis is here. We do our analysis…
Hi Traders! SP500 short term forecast update and follow up is here. On December 18th,…
Hi Traders! AUDNZD short term forecast and technical analysis is here. We do our analysis…
Hi Traders! USDJPY short term forecast update and follow up is here. On January 29th,…
Hi Traders! AUDCHF short term forecast and technical analysis is here. We do our analysis…