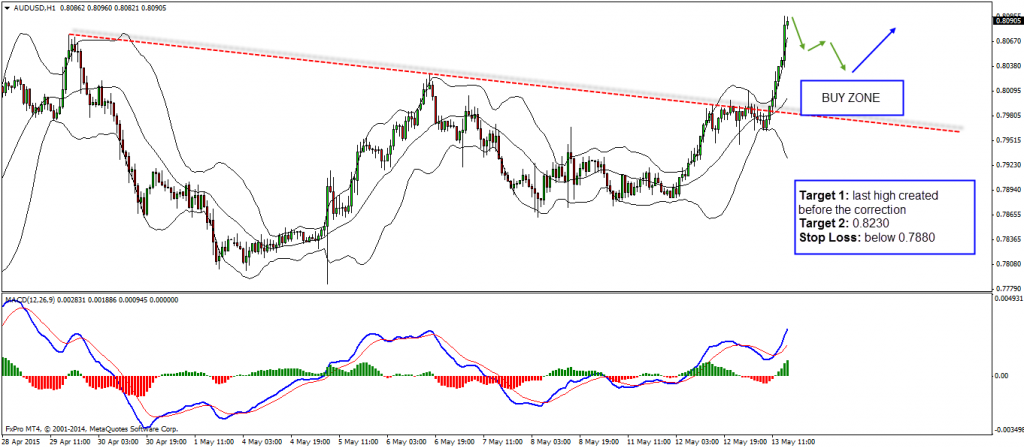
AUDUSD looks very interesting after the break of the triangle well seen on the H4 chart. The situation is pretty simple – we should now look for double wave correction down (you may drop to the H1 chart to spot it easier) and once completed we can look for buy opportunities. Ideally we want to see the price coming closer to a support, along with hidden bullish divergence to form.
Technical Analysis:
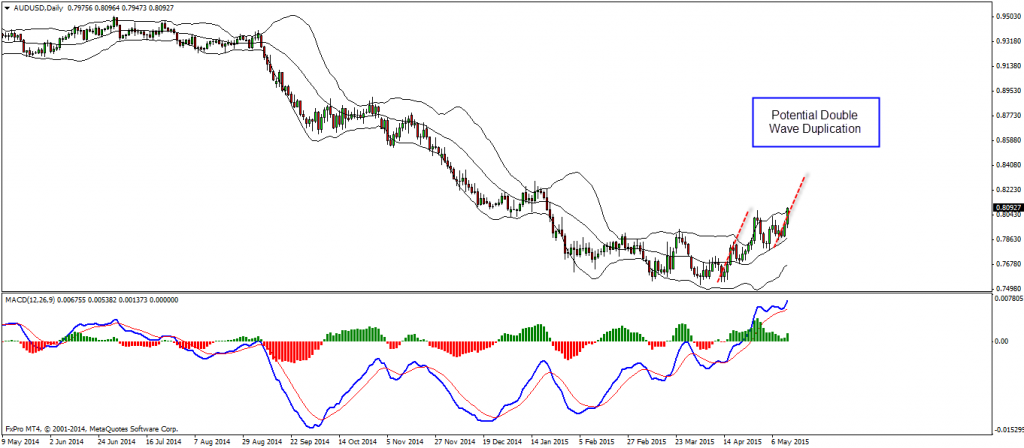
D1 – potential double wave duplication
H4 – break of triangle, potential double bollinger band duplication
Entry:
H1 – wait for double wave correction down, ideally with hidden bullish divergence to form near a support zone
Target 1: last high created before the correction
Target 2: 0.8230
Stop Loss: below 0.7880
Video Explanation:
Yours,
Vladimir
– See more at: http://vladimirribakov.com/forex-market-updates/look-for-buy-setups-after-the-break-of-the-triangle-in-audusd/#sthash.nIYS5dNP.dpuf
The financial markets are entering another potentially volatile trading week, with geopolitical developments likely to…
Hi Traders! Arvinth here from the Home Trader Club team. The weekly summary and, review of July…
U.S. stock indexes hit multi-week lows on Thursday, as concerns over heavy AI spending resurfaced…
Hi Traders! GBPUSD short term forecast and technical analysis is here. We do our analysis…
Hi Traders! Ethereum short term forecast follow-up and update is here. On May 26th, 2026…
Hi Traders! GBPAUD short term forecast and technical analysis is here. We do our analysis…