Hi Traders! NZDCAD forecast and technical analysis is here. The way I would like to analyze the chart for setups is based on multi-timeframe confirmations because in my POV if we get more evidences on different timeframes for the same direction then it makes the setup much more reliable. If you would like to learn more about the way we trade and the technical analysis we use then check out the Traders Academy Club Spoiler alert – free memberships are available! Let’s start our analysis from the highest timeframe which will be the daily chart here.
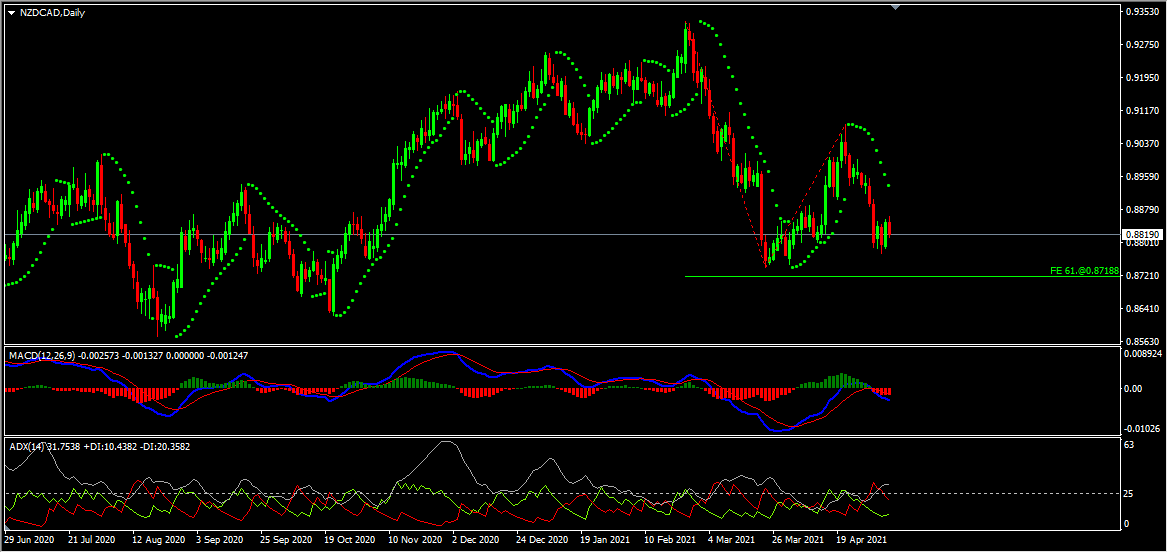
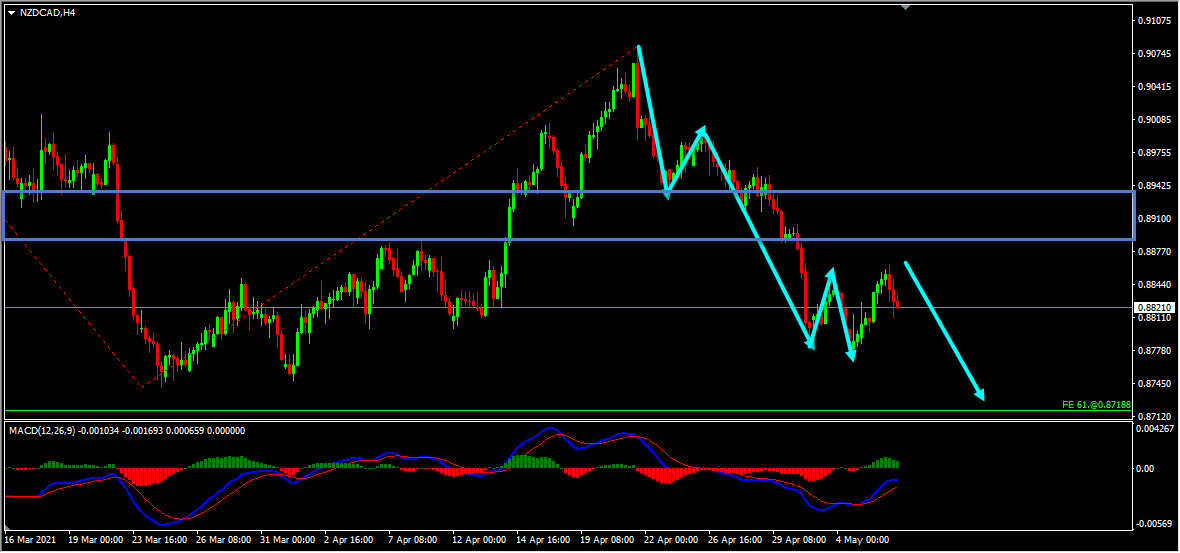
On the daily chart the price which is moving lower has created a potential double wave down and while measuring the first wave using the Fibonacci expansion tool we could see that the price still has room lower towards the 61.8% (0.87188) Fibonacci expansion level. Also, currently there are no signs opposing this bearish view. Based on the Parabolic Sar we could see that the dots are above the price which we may consider as evidence of bearish pressure. In addition to this, the ADX indicator gave a bearish signal here at the cross of -DI (red line) versus +DI (green line) and the main signal line (silver line) reads value over 25 which we may consider as yet another evidence of bearish pressure. So everything looks good here for the bears and we may now move down to lower timeframe and look for evidences supporting this bearish view.
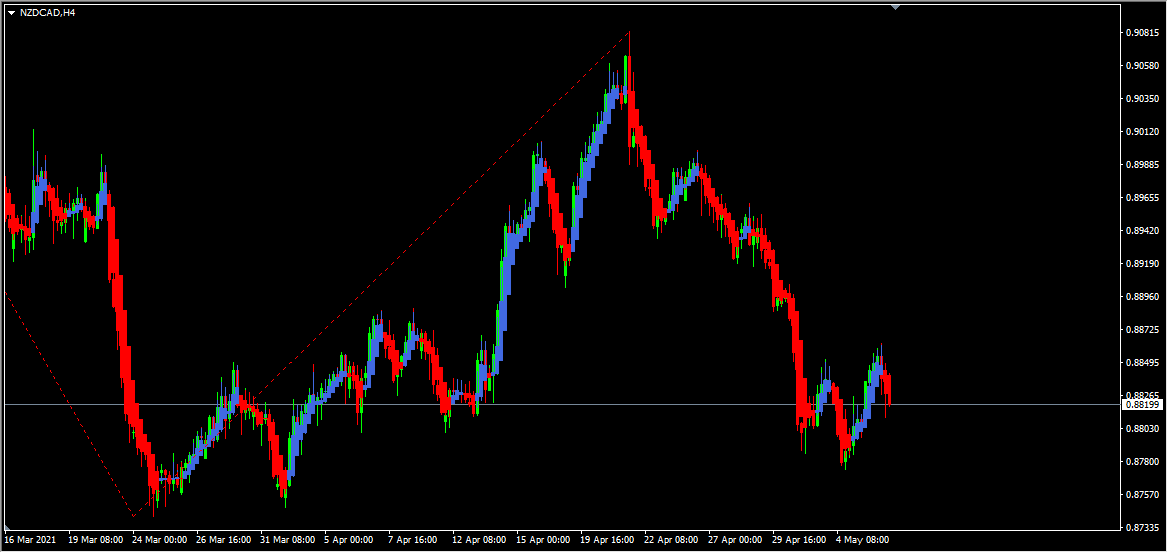
On the H4 chart, based on the Heikin Ashi candles we can see that currently, we have strong bearish bodies in downward moving market conditions so it basically reflects a bearish environment.
NZDCAD D1(Daily) Chart Analysis
NZDCAD H4(4 Hours) Chart Analysis
It is always recommended to look for confirmations before you jump into any trade. If you are not sure about how to trade this sell setup then you can use any setup and strategy that you have in your arsenal to look for bearish moves and join this sell trade.
Also don’t forget to protect your sell trade using a stop loss and make sure to set a target and keep a proper risk/reward ratio.
You will also find a pretty extensive database of educational materials here in the blog – just use the search or check out the Forex Education section above.
Not sure how to enter a trade? Spot reversals (bounces)? Not sure how to spot breakouts?
I invite you to join us in our live market analysis, on daily basis, and improve your trading with us.
Also, you can get one of our strategies free of charge. You will find all the details here
If you have any further questions, don’t hesitate to drop a comment below!
To your success,
Vladimir Ribakov
Certified Financial Technician
Hi Traders! Arvinth here from the Home Trader Club team. The weekly summary and, review of July…
European markets edged lower on Thursday following more overnight volatility in Asia’s tech-dominated indexes, while…
Hi Traders! EURGBP short term forecast and technical analysis is here. We do our analysis…
Hi Traders! Bitcoin short term forecast update and follow up is here. On May 7th,…
Hi Traders! AUDJPY short term forecast and technical analysis is here. We do our analysis…
Hi Traders! Oil short term forecast and technical analysis is here. We do our analysis…