Hi Traders! Ripple forecast follow up and update is here. On December 16th I shared this “Ripple Forecast And Technical Analysis” post in my blog. In this post, let’s do a recap of this setup and see how it has developed now. If you would like to learn more about the way we trade and the technical analysis we use then check out the Traders Academy Club. Spoiler alert – free memberships are available!
My Idea:
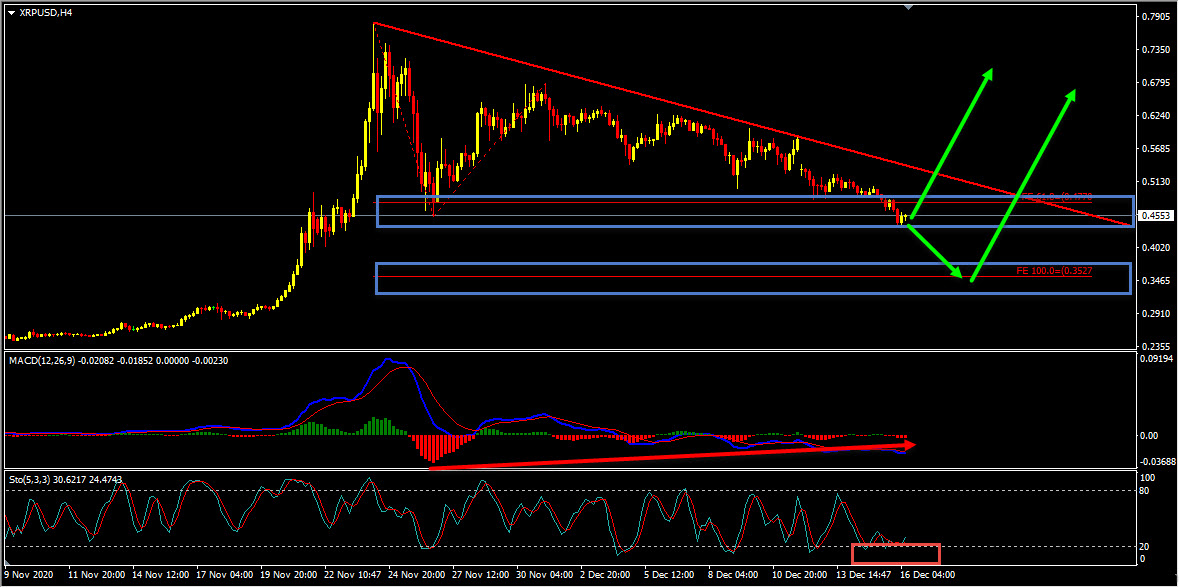
“On the H4 chart while measuring the first wave we have using the fibonacci expansion tool we could see that the price has currently reached the 61.8%(0.4770) fibonacci expansion level. Also we have a bullish divergence that has formed between the first low that has formed on 26th November 2020 and the second low that has formed on 16 December 2020. This bullish divergence supports the daily bullish hidden divergence and acts as evidence of bullish pressure. In addition to this based on the Stochastic Oscillator we could see that the price has reached its extreme here as well which we may consider as another evidence of bullish pressure. Also we have a good downtrend line that has formed, if we get a valid breakout above this downtrend line we may then consider it as a fact provided by the market supporting the bullish view and may expect the price to continue higher further. Alternatively if the price breaks below the 61.8%(0.4770) fibonacci expansion level then the next important support zone to look for bullish evidences would be the 100%(0.3527) fibonacci expansion level. Until both these support zones hold my view remains bullish here”.
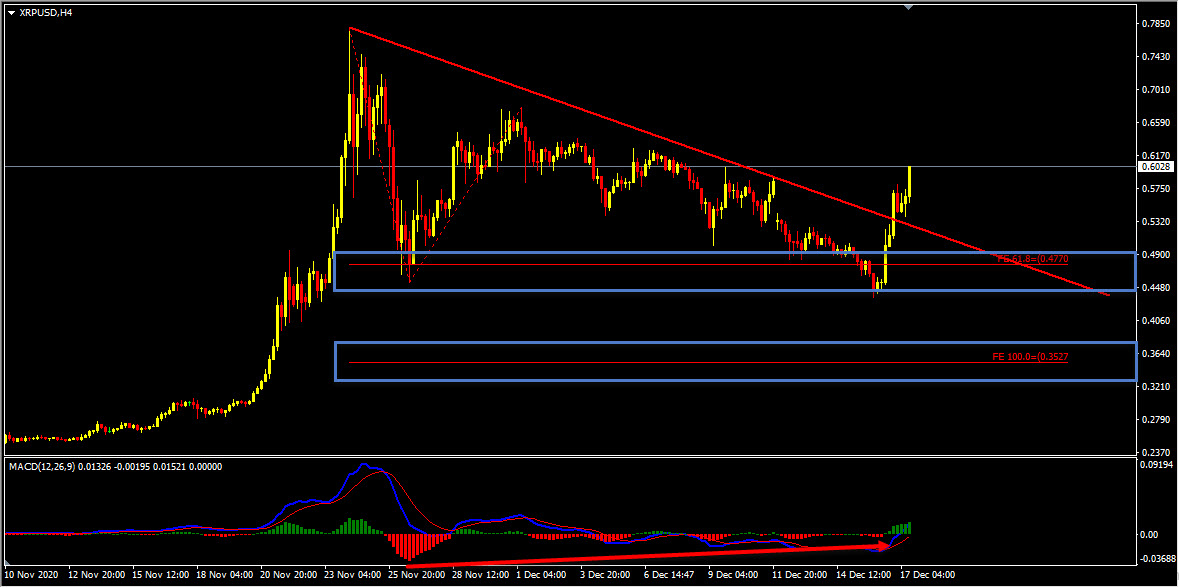
On the H4 chart the price action followed my analysis and moved as per the scenario 1. That is price respected the first support zone and bounced higher from this zone. We also had a bullish divergence in play and the Stochastic Oscillator had reached its extreme, which we considered as evidences of bullish pressure. Also, I mentioned that “we have a good downtrend line that has formed, if we get a valid breakout above this downtrend line we may then consider it as a fact provided by the market supporting the bullish view”. The price which was moving higher provided a valid breakout above this dynamic resistance, which we may consider as a validation for the bullish view. The price then moved higher further and has provided a nice move to the upside so far.
(Note: You can learn about a Killer Forex Strategy “Double Trend Line Principle” here)
So, traders, this is why I wanted to show this example to help you understand how important it is to follow the facts. The facts were supporting the bullish view here and there were no signs against it. When the facts do happen as we expected you can see how the price perfectly moved as per the plan. Because these are the kind of hints the market provides us at majority of the times and it’s our obligation as traders to be able to listen to these things that the market tells us and we should try to make the right actions.
(Note: You can follow us here on Trading View and also on our blog to get similar ideas on a daily basis)
For similar trade ideas and much more join the Traders Academy Club and get access to our complete watch list and trade report.
This is how the report looks like. A table with the hottest market opportunities, screenshot behind every pair and time frame (anything that is in blue inside the table is clickable and leads to a screenshot) + a summary in text format, kind of highlights. And of course Live Market Analysis every single day.
If you have any further questions, don’t hesitate to drop a comment below!
To your success,
Vladimir Ribakov
Certified Financial Technician
Hi Traders! USDCHF short term forecast update and follow up is here. On May 20th,…
Hi Traders! CADCHF short term forecast and technical analysis is here. We do our analysis…
The dollar was broadly steady on Monday as cautious investors watched out for signals on…
Hi Traders! Arvinth here from the Home Trader Club team. The weekly summary and, review of July…
European markets edged lower on Thursday following more overnight volatility in Asia’s tech-dominated indexes, while…
Hi Traders! EURGBP short term forecast and technical analysis is here. We do our analysis…