Watch the webinar of MACD + RSI Powerful Forex Trading Strategy
Hi Traders! MACD (Moving Average Convergence/Divergence), is a powerful trading indicator used in technical analysis. Its function is to reveal changes in the strength, direction, momentum and duration of a trend in any given instrument. Due to it’s unique functionality, MACD is used for trend trading but also to spot divergence.
RSI (Relative Strength Index) is another powerful indicator used in technical analysis that aims to chart the current and historical strength or weakness of an instrument based on the closing prices of a recent trading period. RSI is mainly used to spot overbought and oversold situations on the market but also to find out the current momentum of a given instrument.
Both these indicators very popular, reliable and loved by many traders and play a crucial role in technical analysis. When combining both these powerful indicators together we get a high accuracy trading strategy which I use in my trading to look for trend reversals. In this article, I will explain in detail about this strategy with an example.
The first step here while using this strategy is to look for the MACD indicator to show weakness(divergence). Once the MACD indicator starts showing weakness, we start following the asset for potential reversal and potentially very good risk-reward ratio setups. Next, we want to confirm the potential setup using RSI indicator(Breakouts of important RSI Support/Resistance zones tell us a lot!) The final step is to validate everything that the indicators are showing by price action. Once this step is done, we are ready to trade!
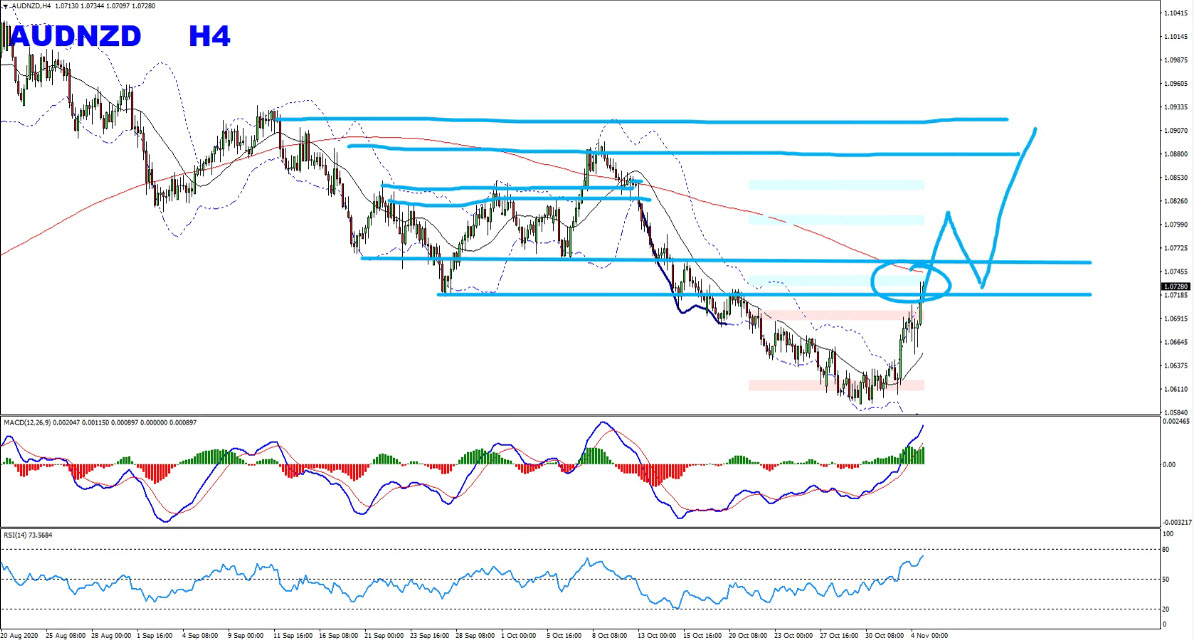
To present this strategy in action I will take an example (AUDNZD) from my Traders Academy Club report.
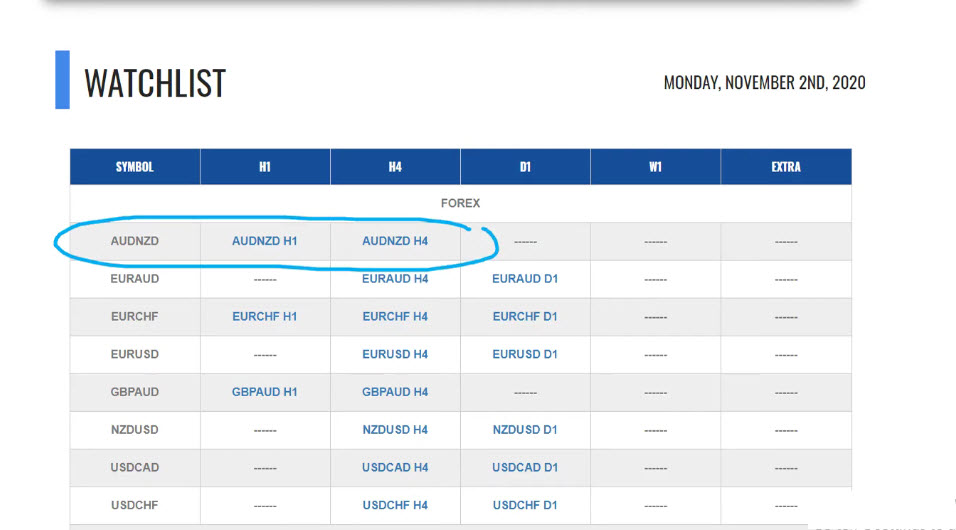
On the table below you can see my trading watch list. This list is all the trading opportunities I share with my followers on daily basis, in Traders Academy Club (Join us here).
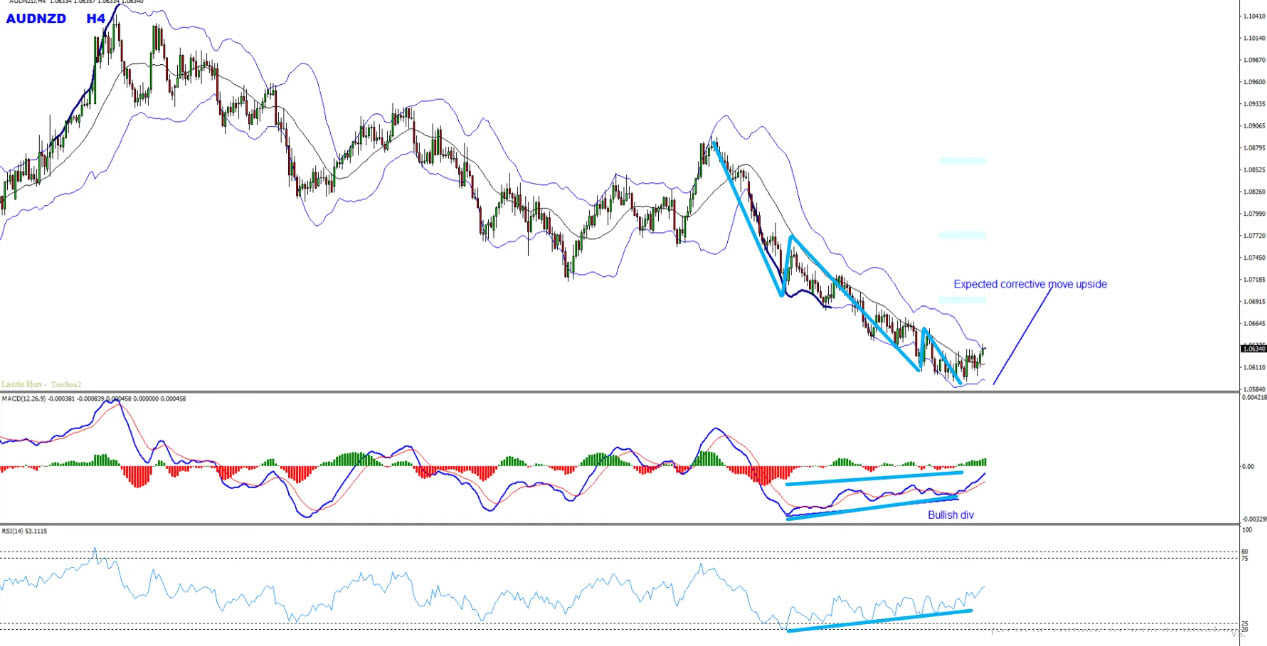
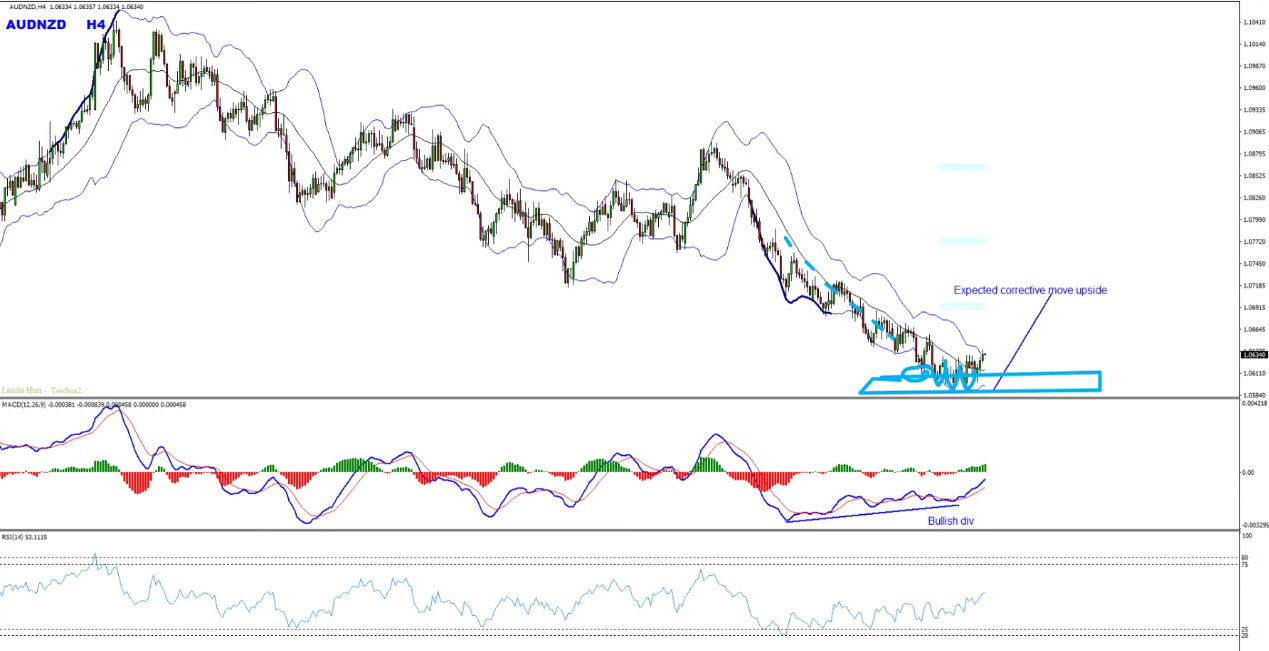
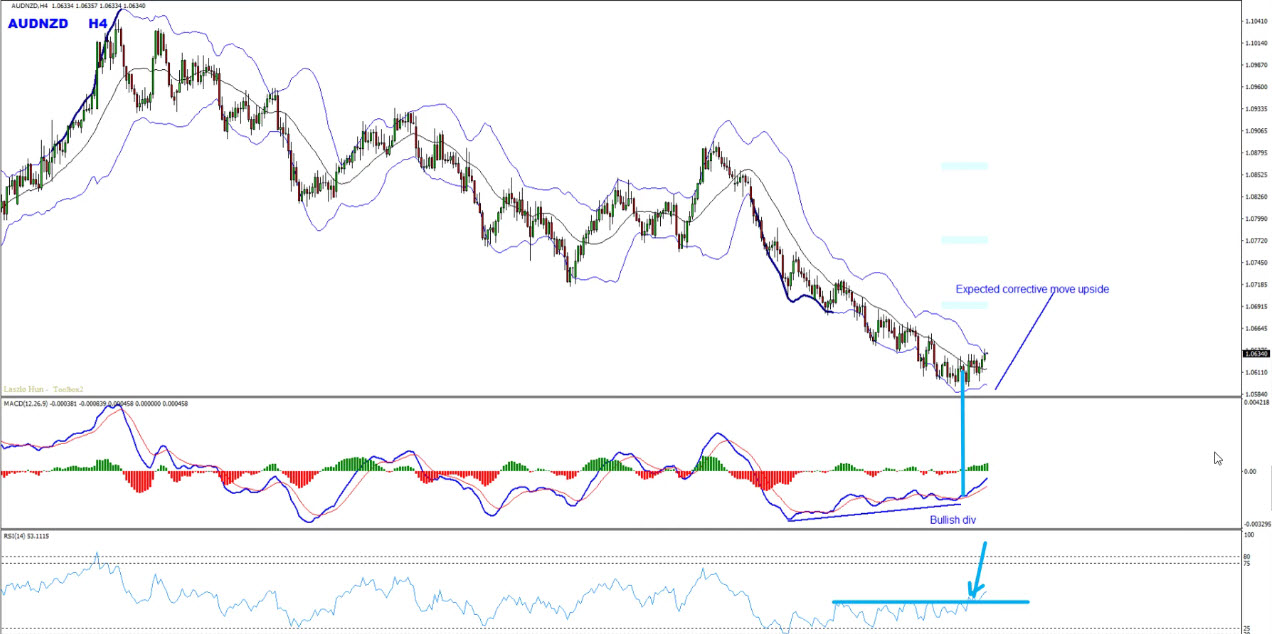
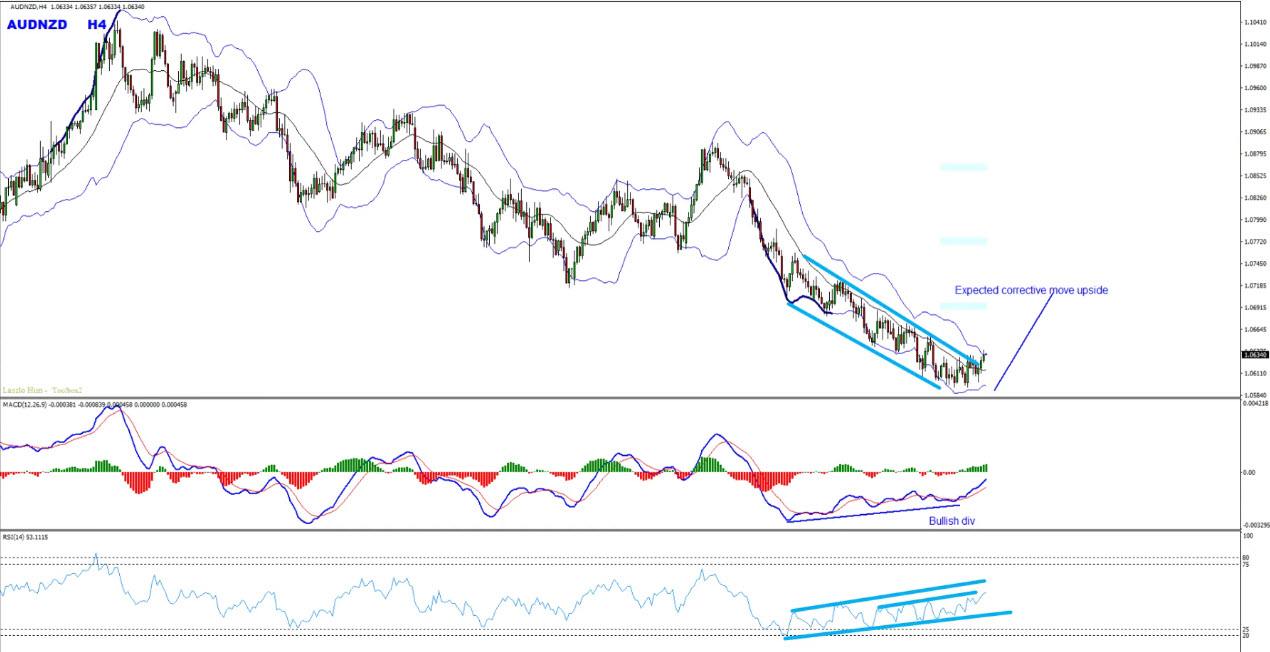
As always I start my technical analysis from the highest timeframe (in combination of three time frames of multi time frame analysis) which in this case will be the H4 chart. Looking at the H4 chart we could see that the price has created three descending waves which pushed to the downside and ended up with bullish divergence. This bullish divergence can be clearly seen on the moving averages and histogram of the MACD indicator and on the RSI indicator as well as you can see on the screenshot below.
Note: If you want to learn more in-depth insights about divergences, you can benefit greatly from the videos on my channel here while also embarking upon Divergence University for comprehensive divergence education.
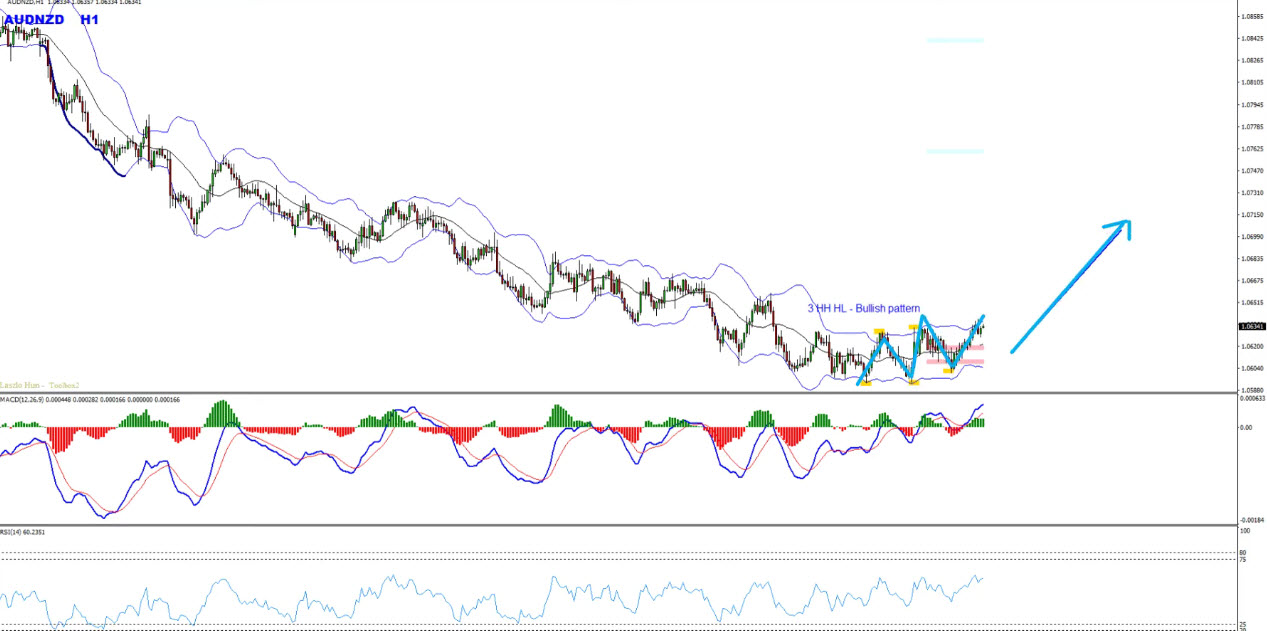
One of the principles that I love to follow is bullish and bearish control based on the pure definition of price action that “buyers create higher highs, higher lows and sellers create lower highs, lower lows”. So in this case, in order to confirm the H4 chart turnaround, we need to see the price creating higher highs, higher lows on the lower timeframe which will be the H1 chart here.
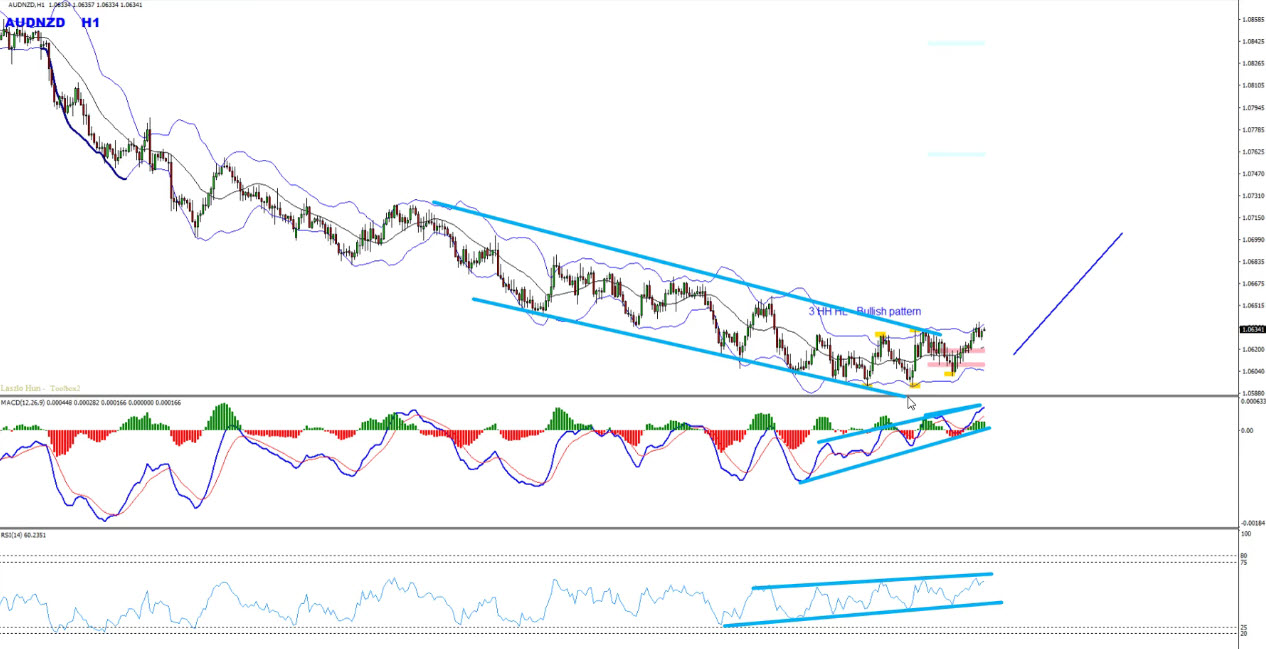
At this moment we can see that the multi-timeframe reads in the same direction, as you can see it starts from the turnaround on the H4 chart, and it fits into the turnaround. The H1 chart gives you the official signs and falls into the same direction that the indicators hint to us, and you get yourself a fantastic opportunity to enjoy from the buys.
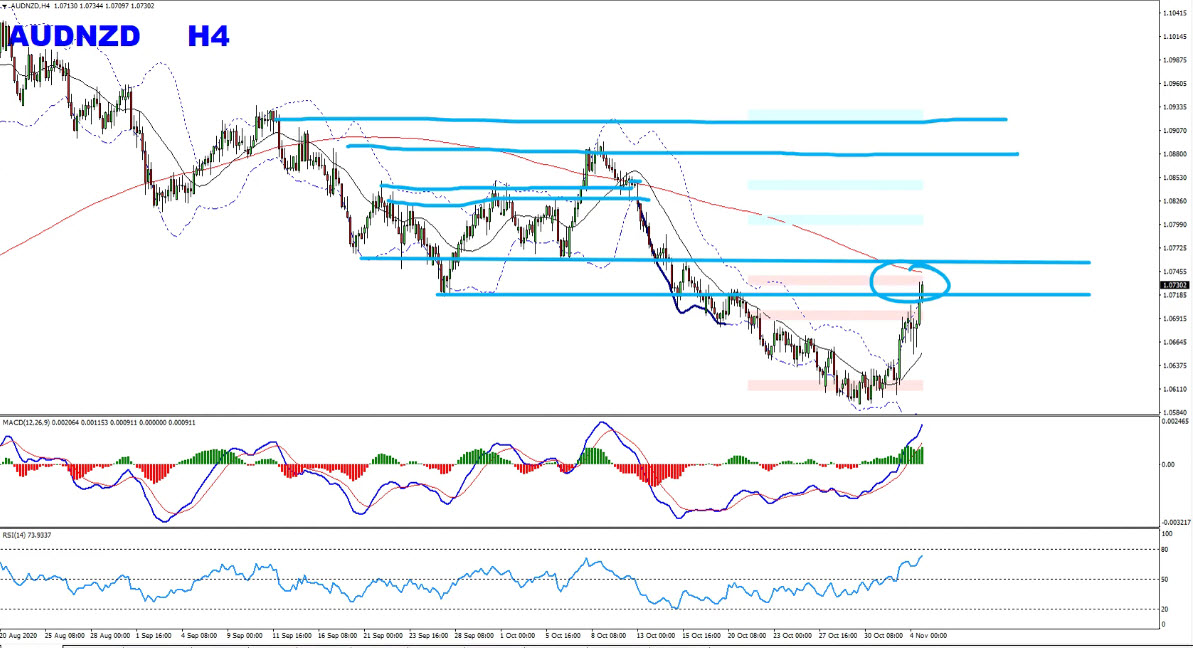
You are good to ride the buys as long as both the H4 and H1 timeframes are gaining the bullish momentum. My suggestion is always to pay attention to the key levels on the go and since we are starting from the H4 chart the next key levels to pay attention to for this pair are the ones shown in the screenshot below.
The answer is no, it doesn’t matter how much we try we don’t know if the levels we marked would reject or not. But you do know that if the price goes through the levels then we are good to continue further and if they are not then you are good to manage your position and enjoy your profits.
Note: If you want to learn about Money Management you can find it here
This strategy is so powerful and accurate because in this strategy we are going to combine two proven in time indicators using multi time frames. Using the price action along with the technical indicators provides very high accuracy trading setups along with a great risk-reward ratio.
If you have no idea about the larger picture on the given market, you are likely going to fall into traps. While the main trend is bullish, why would you be looking for sells? You get the picture. Knowing what is happening on the higher time frames is crucial for successful trading. The synchronization between multiple time frames is one of the strongest weapons you can use for high accuracy trading setups. This is why multi-timeframe analysis is very important.
Simple, when we are joining the new trend from the very beginning we get to enjoy very large moves from tops/bottoms which provides us an amazing risk-reward ratio. The potential target zones are determined using price action (strong/key support and resistance zones depending on the direction of the trade).
So traders this is how I use this strategy in my trading to find great possible trades. When you are able to spot this turnaround (and\or join bigger trends) on the two timeframes combined with these two powerful indicators (MACD + RSI) then you got yourself a fantastic risk-reward opportunity which can work in your favor with high probability and end up as a winner.
I invite you to join me in my club and enjoy from our Live Market Analysis and our trading reports on a daily basis and improve your trading with us.
Also, you can get one of my strategies free of charge. You will find all the details here
Thank you for your time in reading this article.
Yours to success,
Vladimir Ribakov
Certified Financial Technician
The dollar was broadly steady on Monday as cautious investors watched out for signals on…
Hi Traders! Arvinth here from the Home Trader Club team. The weekly summary and, review of July…
European markets edged lower on Thursday following more overnight volatility in Asia’s tech-dominated indexes, while…
Hi Traders! EURGBP short term forecast and technical analysis is here. We do our analysis…
Hi Traders! Bitcoin short term forecast update and follow up is here. On May 7th,…
Hi Traders! AUDJPY short term forecast and technical analysis is here. We do our analysis…