Hi Traders! US Dollar Index forecast update and follow up is here. On July 9th I shared this US Dollar Index Forecast And Technical Analysis post in my blog. In this post, let’s do a recap of this setup and see how it has developed now. If you would like to learn more about the way we trade and the technical analysis we use then check out the Traders Academy Club. Spoiler alert – free memberships are available!
Missed this trade?
Never miss a trade opportunity again! Join the Traders Academy Club
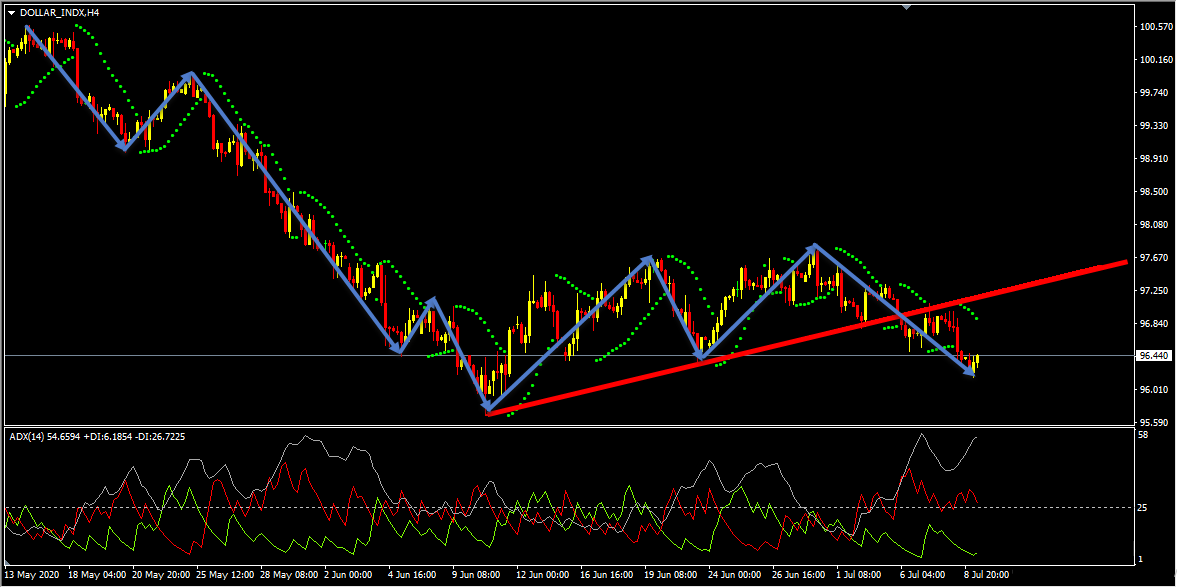
On the H4 chart after the bearish trend pattern, we had an ABCD correction followed by the most recent uptrend line breakout, and based on this I was expecting the price to continue lower further after pullbacks.
(Note: You can learn about a Killer Forex Strategy “Double Trend Line Principle” here)
(Note: You can download the Hidden Divergence e-book here)
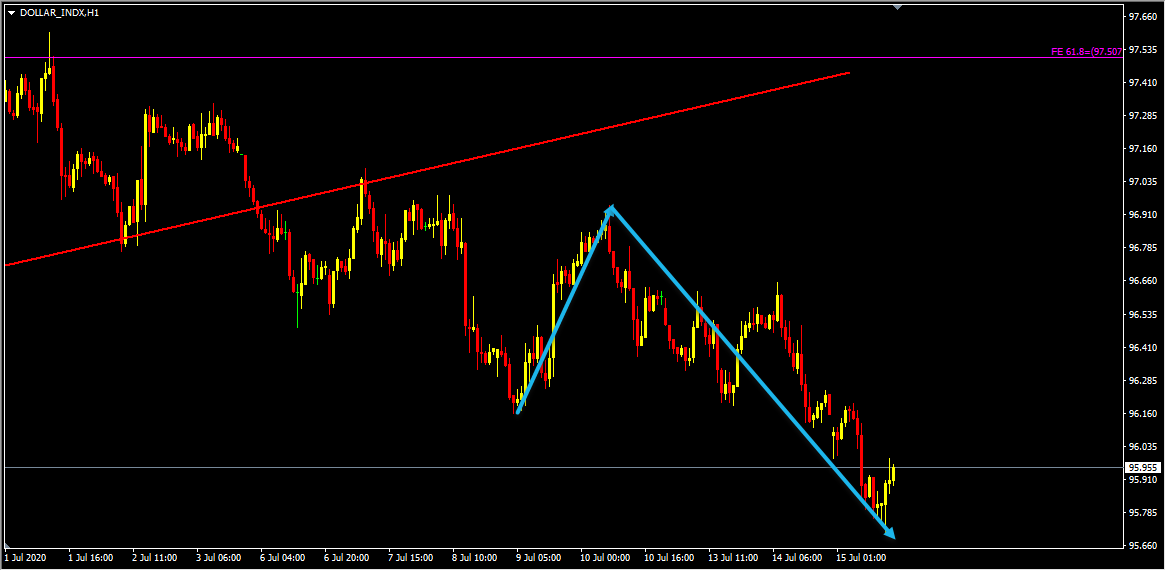
You can see this move clearly on the H1 chart below.
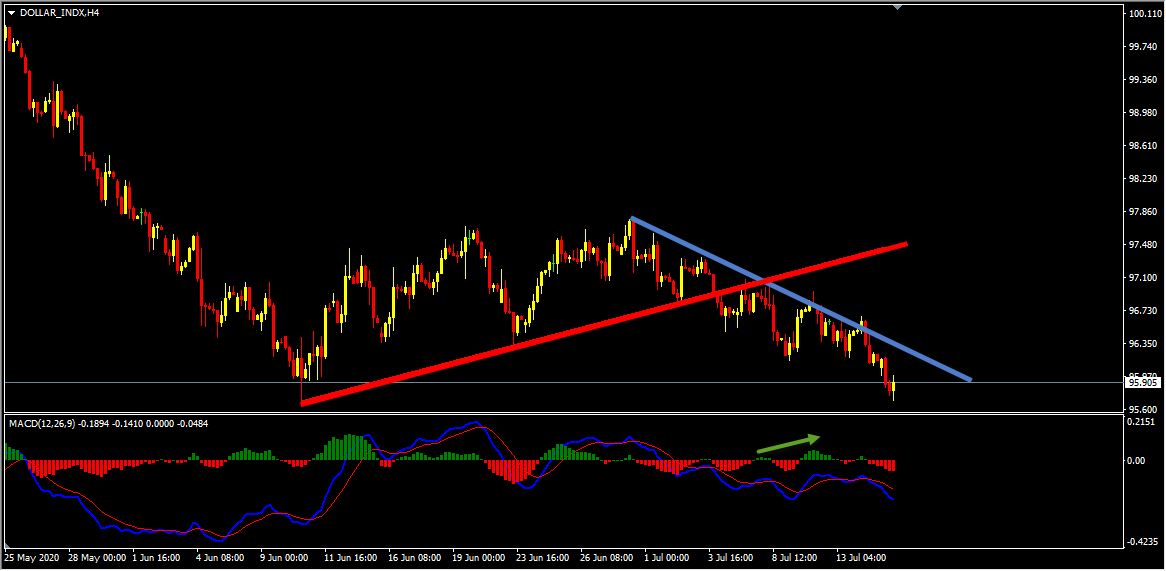
We need to understand the fact that the market doesn’t care if we need to buy or sell an instrument the market does what it has to do. As traders we have to hold our horses, we shouldn’t expect our wishes or rumors to happen, we should wait for the facts to happen and when the facts fit in then that’s our opportunity to do any sort of trading. As long as it didn’t happen everything remains as an expectation for us. As you can see in the example above the facts happened as we expected in the form of a false break of dynamic resistance with bearish hidden divergence and the price moved lower exactly as I expected it to. This is why we should always trade based on the facts.
For similar trade ideas and much more join the Traders Academy Club and get access to our complete watch list and trade report.
This is how the report looks like. A table with the hottest market opportunities, screenshot behind every pair and time frame (anything that is in blue inside the table is clickable and leads to a screenshot) + a summary in text format, kind of highlights. And of course, Live Market Analysis every single day.
If you have any further questions, don’t hesitate to drop a comment below!
Happy Trading!
Yordan Kuzmanov
Chief Trader at the Traders Academy Club
Hi Traders! USDCHF short term forecast update and follow up is here. On May 20th,…
Hi Traders! CADCHF short term forecast and technical analysis is here. We do our analysis…
The dollar was broadly steady on Monday as cautious investors watched out for signals on…
Hi Traders! Arvinth here from the Home Trader Club team. The weekly summary and, review of July…
European markets edged lower on Thursday following more overnight volatility in Asia’s tech-dominated indexes, while…
Hi Traders! EURGBP short term forecast and technical analysis is here. We do our analysis…