Hi Traders! Arvinth here from Traders Academy Club team. Weekly summary and review February 18th, 2022 is here. It is now time to recap and summarize the trade setups that we had during this week. Below you will find the short explanation of all the trade setups we had this week and how it has currently developed now.
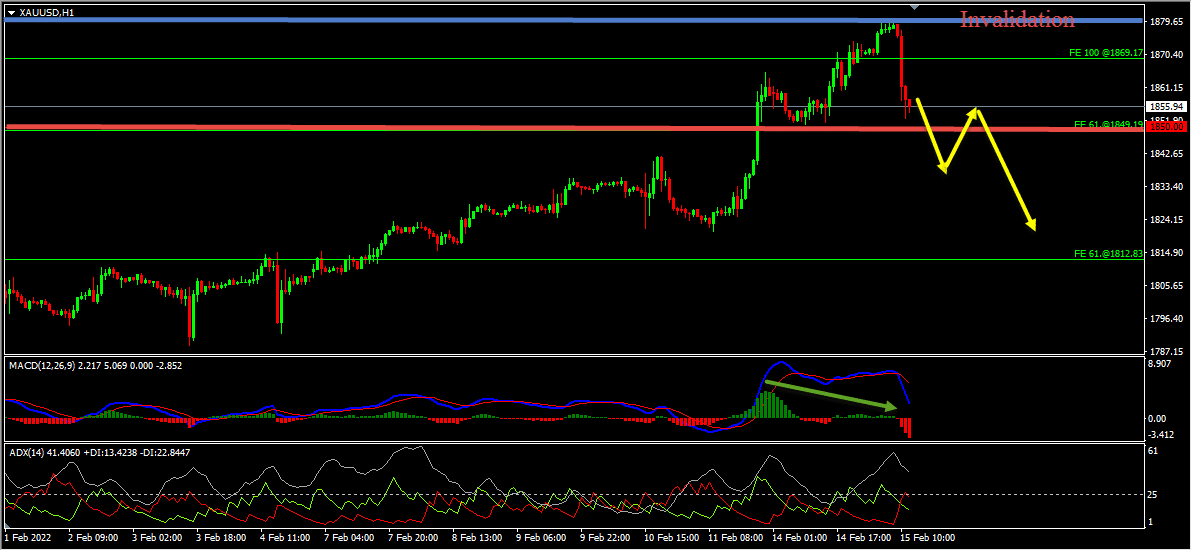
Gold – My idea here was “On the H1 chart, we have a bearish divergence that has formed between the first high that has formed at 1865.39 and the second high that has formed at 1879.44 based on the MACD indicator which we may consider as evidence of bearish pressure. In addition to this, the ADX indicator gave a bearish signal here at the cross of -DI (red line) versus +DI (green line) and the main signal line (silver line) reads value over 25 which we may consider as another evidence of bearish pressure. So the bottom line here is that the H1 chart has evidences supporting this short term bearish view. Until the invalidation level shown in the image below holds my short term view remains bearish here. If we get a valid breakout below 1850 level we may then consider it as a validation for this short term bearish view and may expect the price to move lower further”.
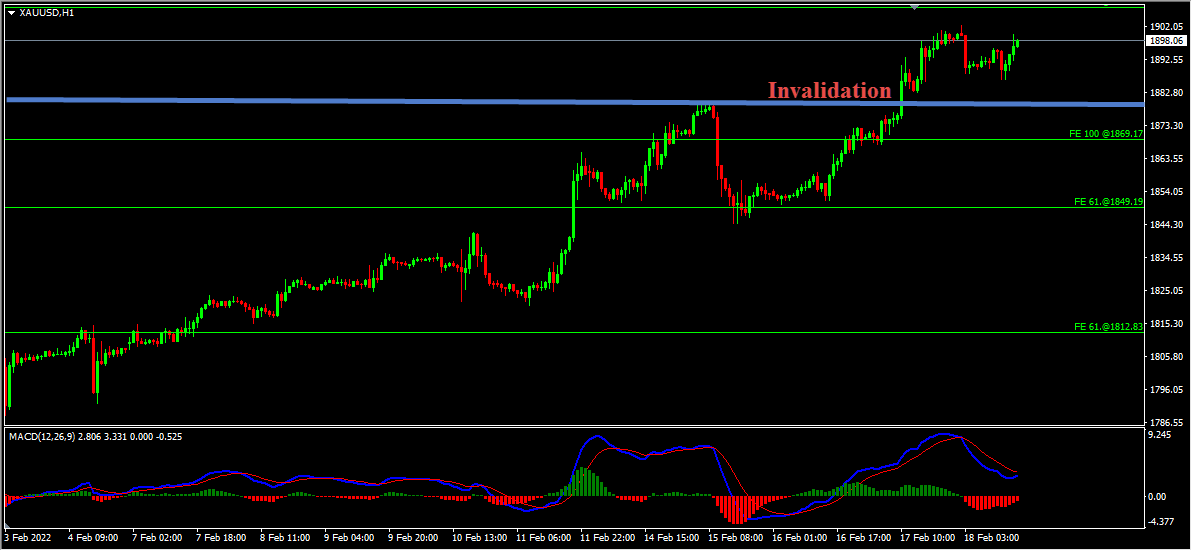
Current Scenario – The price action didn’t follow my analysis in Gold and this idea failed, as the price moved higher, broke above the invalidation level and is currently holding above it. My current view on Gold is neutral.
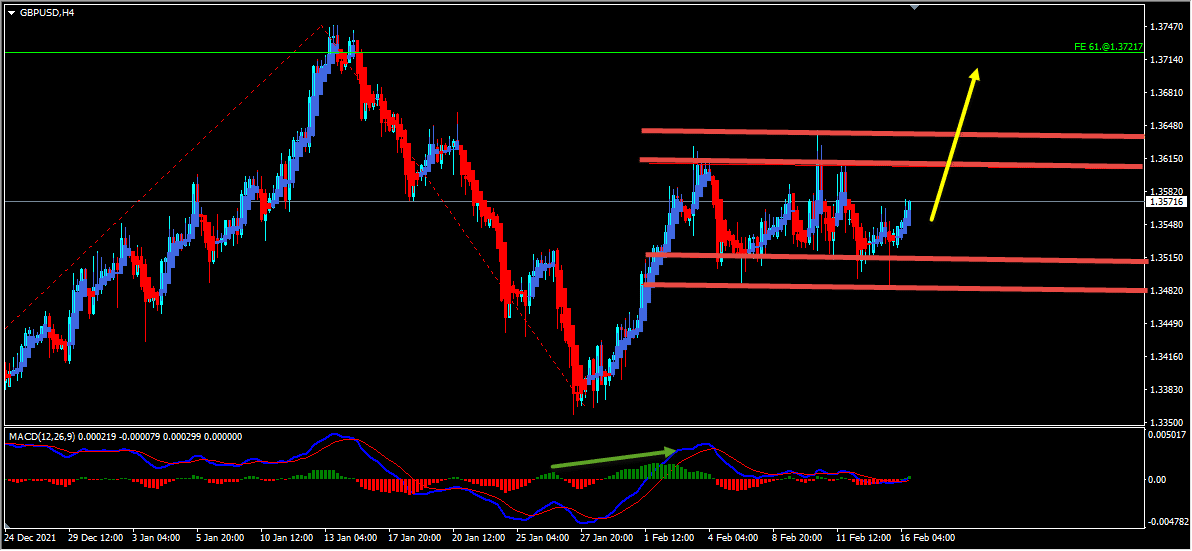
GBPUSD – My idea here was “On the H4 chart, based on the Heikin Ashi candles we can see that currently, we have strong bullish bodies in upward moving market conditions so it basically reflects a bullish environment. Also, we could see that the price which was moving higher has created higher highs based on the MACD indicator, which is a sign of gaining momentum towards the bullish side. After the first move to the upside currently it looks like a flat correction is happening in the form of a range. This range is formed by the highs and lows reaching parallel support and resistance zones. The price which is respecting this range so far has reached the bottom of this range, respected it and bounced higher from this zone. Currently the price has reached the middle of this range. If we get a valid breakout above the top of the range we may then consider it as a validation for this short term bullish view and may expect the price to move higher further towards the key resistance zones”.
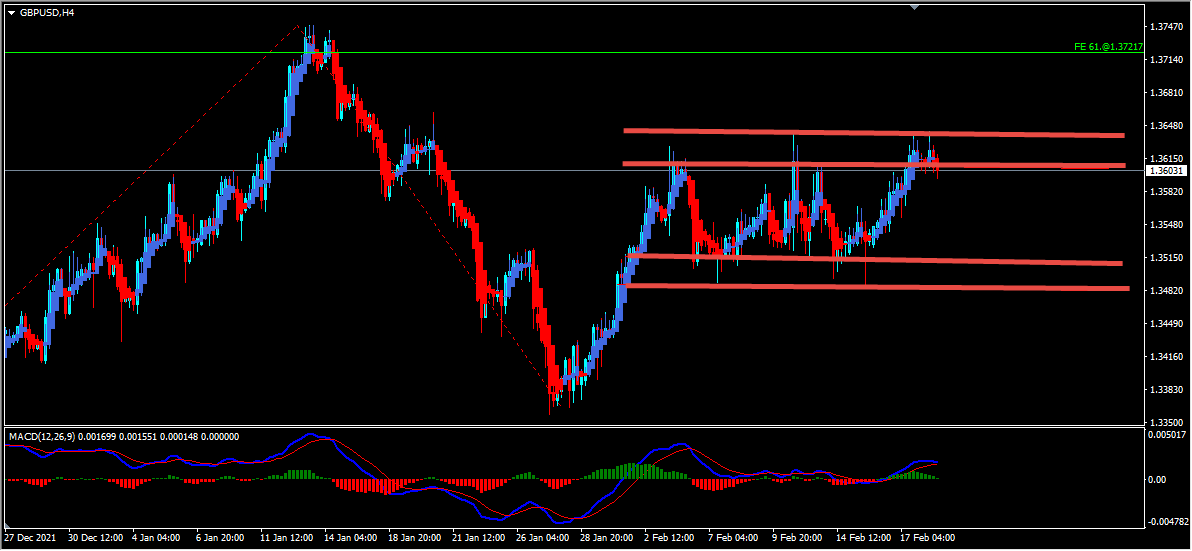
Current Scenario – In this pair, the validation for the short term bullish view which is a valid breakout above the top of the range didn’t happen yet. My plan still remains the same here, that is “if we get a valid breakout above the top of the range we may then consider it as a validation for this short term bullish view and may expect the price to move higher further towards the key resistance zones”.
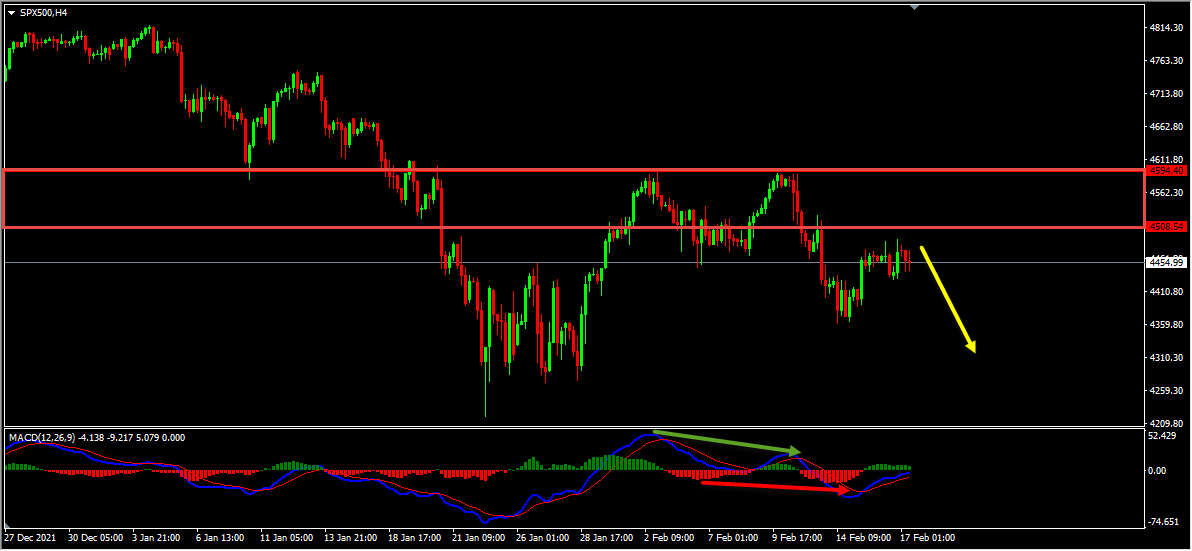
SP500 – My idea here was “On the H4 chart, the price which was moving higher has created a bearish divergence between the first high that has formed on 2nd February 2022 and the second high that has formed on 9th February 2022 based on the MACD indicator. The price then moved lower and broke below the last low that has formed on 4th February 2022 creating lower lows, thus forming a classical setup of bearish divergence followed by bearish convergence, we may consider these as evidences of bearish pressure. Generally, after a bearish convergence we may look for corrections and then further continuation lower. Currently, it looks like a pullback is happening. Until the strong resistance zone (marked in red) shown in the image below holds my short term view remains bearish here and I expect the price to move lower further”.
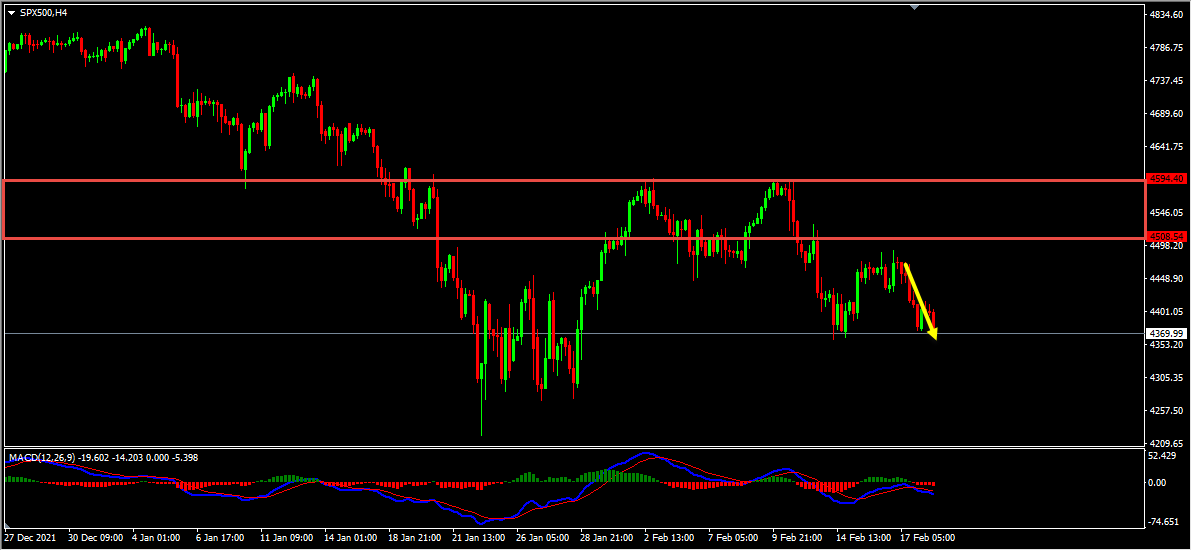
Current Scenario – Based on the above-mentioned analysis my short term view was bearish here and I was expecting the price to move lower further until the strong resistance zone holds. The price action followed my analysis exactly as I expected it to here and it moved lower further delivering a nice move to the downside so far.
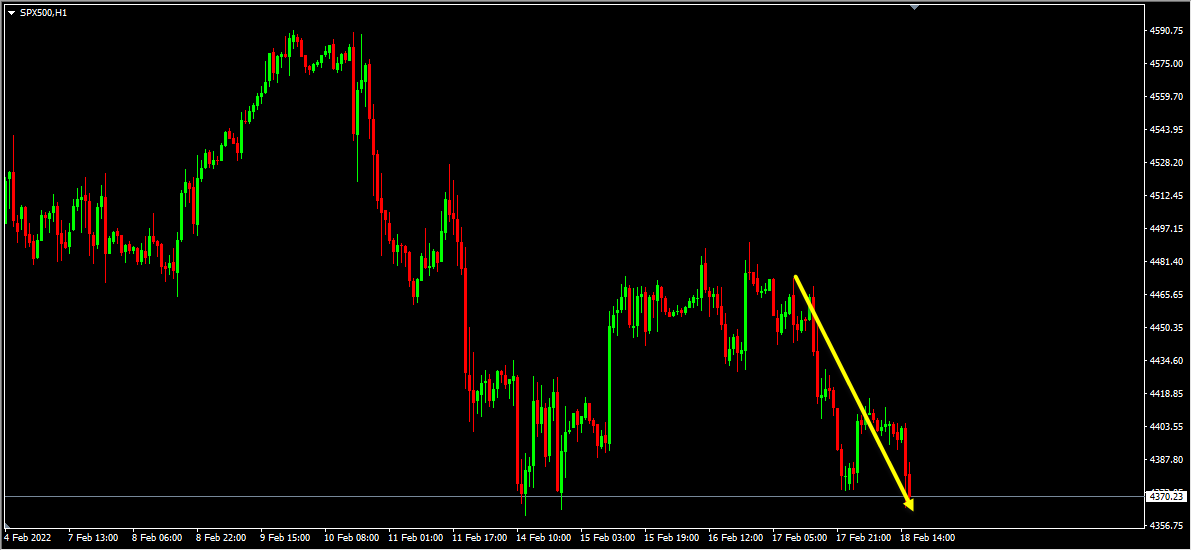
You can see this move clearly on the H1 chart below.
Note: You can follow us here on Trading View and also on our blog to get similar ideas on daily basis)
For similar trade ideas and much more I invite you to join the Traders Academy Club and improve your trading with us.
You will also find a pretty extensive database of educational materials here in the blog – just use the search or check out the Forex Education section above.
If you have any further questions, don’t hesitate to drop a comment below!
Happy Trading!
Arvinth Akash
Traders Academy Club Team.
Hi Traders! Arvinth here from the Home Trader Club team. The weekly summary and, review of July…
European markets edged lower on Thursday following more overnight volatility in Asia’s tech-dominated indexes, while…
Hi Traders! EURGBP short term forecast and technical analysis is here. We do our analysis…
Hi Traders! Bitcoin short term forecast update and follow up is here. On May 7th,…
Hi Traders! AUDJPY short term forecast and technical analysis is here. We do our analysis…
Hi Traders! Oil short term forecast and technical analysis is here. We do our analysis…