


Support-Resistance zones are inevitable part of trading just like Trend Lines (read here the article on Trend Lines which also includes a free trading strategy). So in this post i would like to continue the subject and talk more about the S/R zones.
Support-Resistance Definition:
These are exact market zones where the price tends to hold above or below. These zones are determined by number of times the price has stopped and reversed.
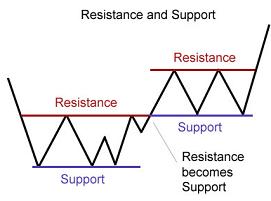
See the example above. These zones are called “Support” when the price is above them, and “Resistance” when price is below them.
How to spot a Support-Resistance Zone?
It is actually very easy. Open a chart, zoom out and see where the price has stopped multiple times. Look at the example below:
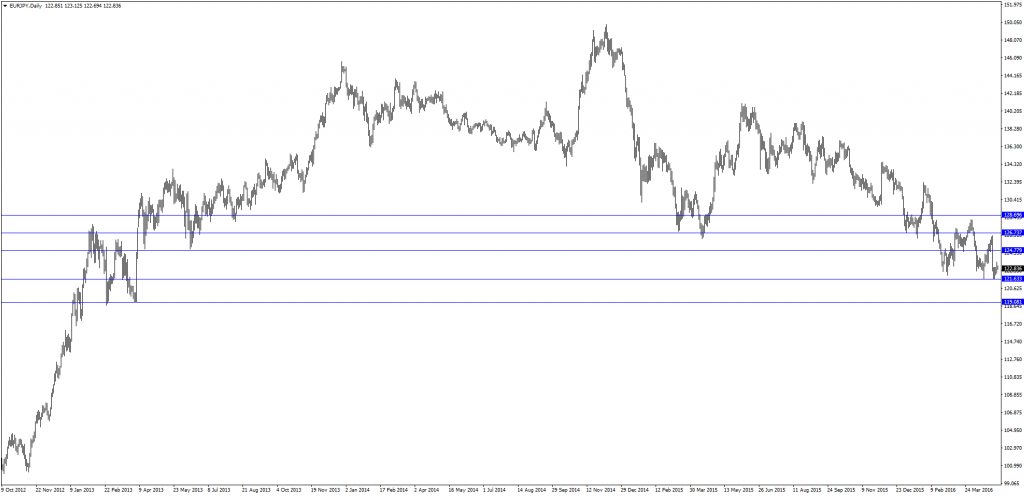
It is really important to mention that S/R zones are ZONES. Not lines. A range that you can spot and rely on usually on higher time frames. For example a weekly support has bigger chances to make the price bounce up from it. Just keep in mind that If you are looking at M15 chart, these zones may not be as reliable. My advise is to stick to Weekly/Daily/H4 charts mainly.
Let’s have a look at another example:
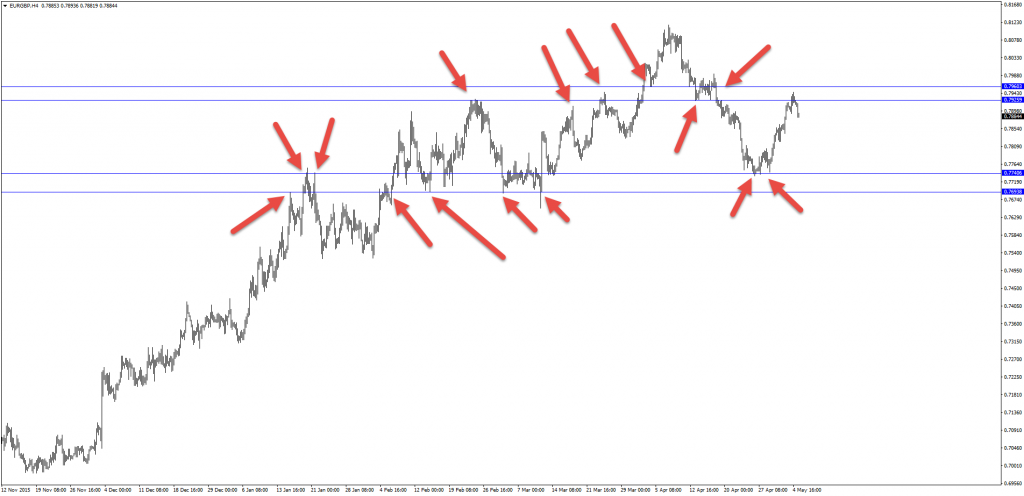
Notice how if price is below such level tend to bounce back down and when above it, push higher after testing it.
How to use Support-Resistance zones in trading?
You will find multiple applications of S/R zones in your trading every single day. You can use them as entry points, stop loss levels and target zones. Again the higher the time frame the more reliable but if you use them in conjunction with other tools they become a lethal weapon in the hands of the trader. My favorite ones are Fibonacci levels (retracement, extensions), Trend Lines and Divergences. I will actually show you some great ways to find outstanding risk reward trades using only what i have mentioned above.
In summary – you can use the Support-Resistance zones as:
- Entry Points
- Breakout levels
- Stop Loss
- Targets
Trading The Support-Resistance:
The idea really simple. There are two scenarios that we trade: breakouts and bounces.
You may find other ways to trade the breakouts and bounces on the internet, however i have found that the methods explained below work best for me but i’m sure you will love it as well.
The Breakout
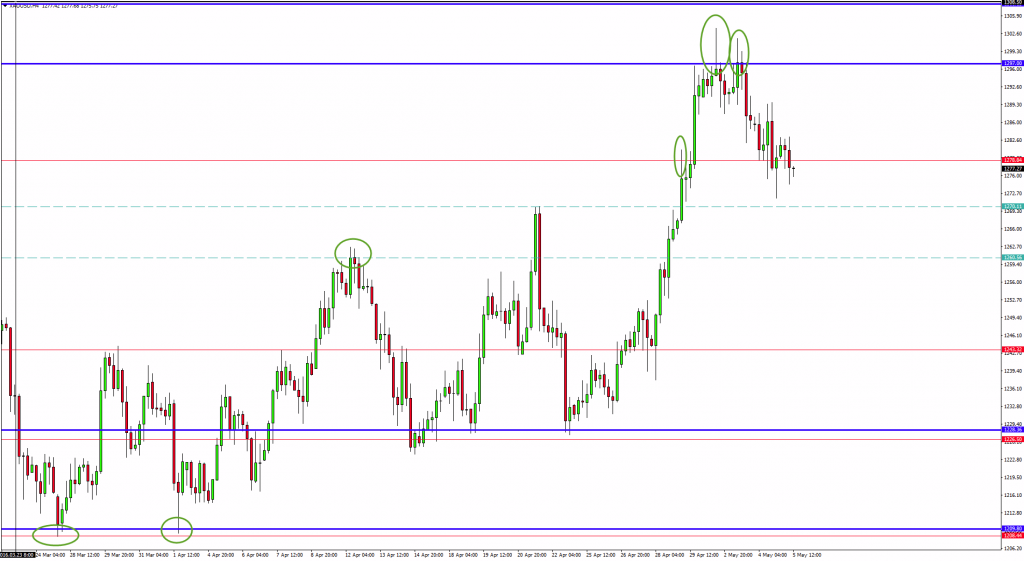
- First thing for both methods will be to draw your horizontal S&R zones on the chart. Start with Weekly go through daily and finish with H4. You can try to use different colors for each time frame to have a visual idea which one represents what TF.
Tick Blue lines represent Weekly S/R Zones
Red Lines – Daily
Dashed Line – H4
Try not to put too many lines as the chart will become an obstacle for you. Just find the most recent an relevant ones to you.
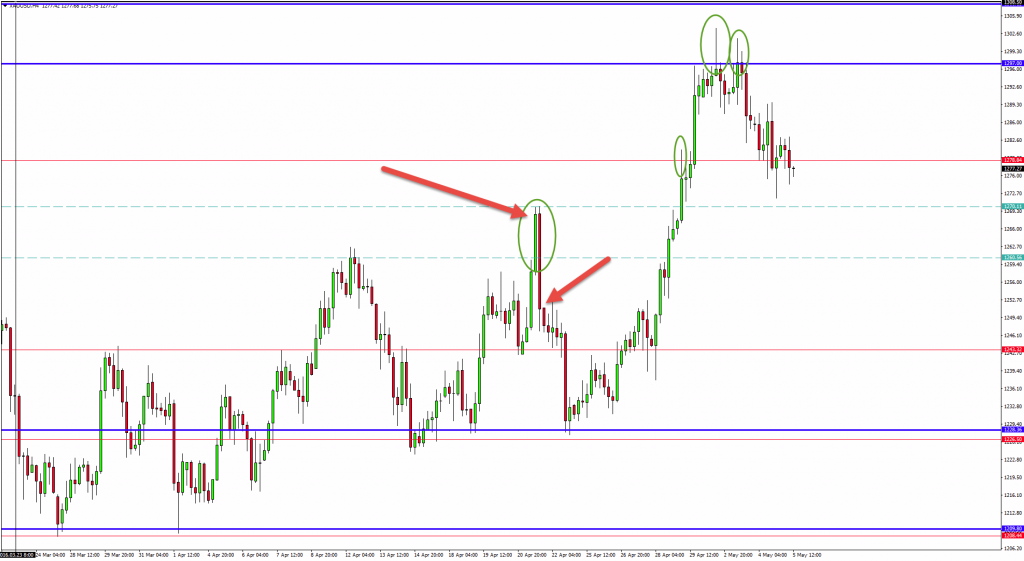
2. Next step would be to zoom in and look for false breaks. A false break is a situation when the price tries to push through an S/R zone but fails. The great part is that with pure price action we can determine these “failed attempted” very easily on the chart.
Notice how the price will create a spike. It will penetrate the level, then immediately retrace. For example price is pushing higher, reaches a resistance zone, creates as pike and bounces from it. This would happen as bulls momentum is not enough at the moment and bears take control. We want to look for such bars (also called Pin Bars) and another type of false break. Second type will consist of the following: Price breaks and closes above (for example) such zone. After one maximum 2 bars, bulls fail and bears push the price lower, below the zone. This process creates the false break pattern which we are looking for.
Once the big red candle closes below we can look to sell.
Stop Loss:
Place your stop loss above the high (if it is a buy it would be below the low) created.
Targets:
The first target should be at least with 1:1 risk reward, which in other words mean that if you have a stop loss of 100 pips, first target should be also at least 100 pips.
Now on to the next method which is:
The breakout
To trade the breakout of S/R zones, you will use the same lines that you have plotted. However this time we look for actual breakout. Once the breakout is confirmed we can take the trade.
- Breakout
- Re-test/Confirmation
- Entry
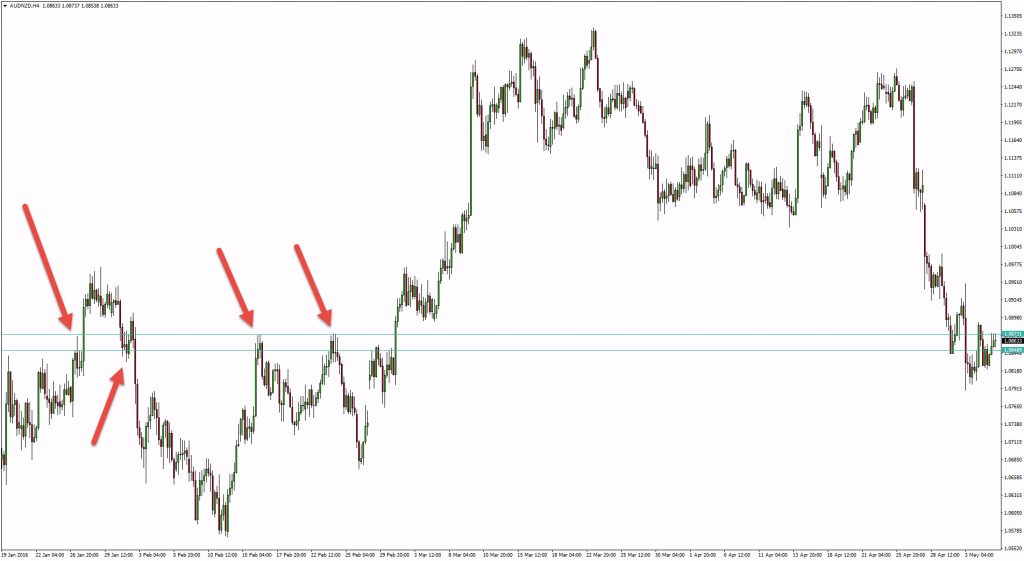
You can see that the price really respected this zone marked with the arrows above. No after we had the breakout to the upside we can look for buy trades as expectations and odds are that the price will continue higher.
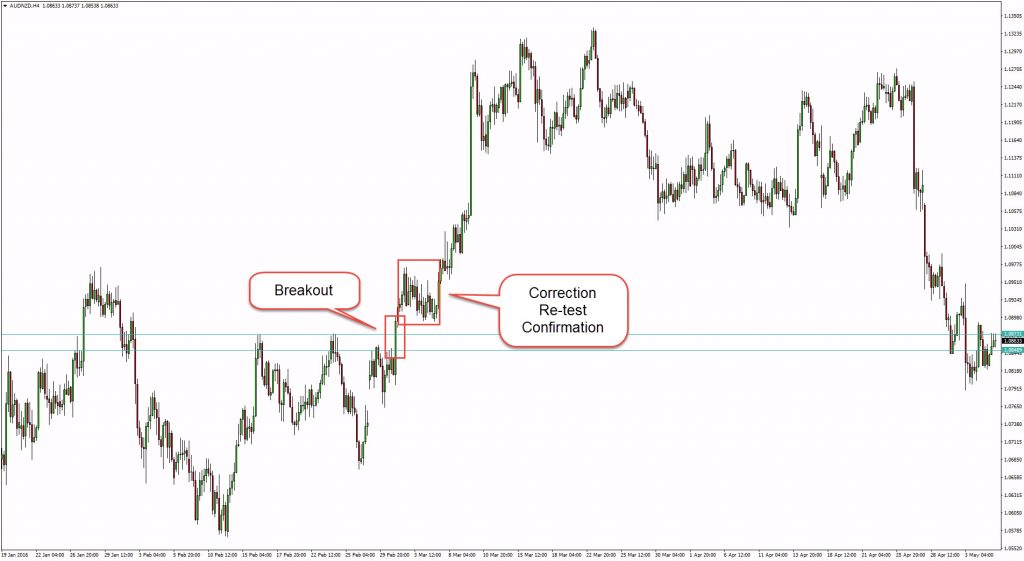
To recap: the price broke up through strong resistance zone (which now becomes a support zone), and it went for correction. 2 our of 3. Now we want to find the best risk:reward entry possible. There are two options you can try to trade. Which one works and suits you best is up to you to find out.
- Trend line break
- Last high/low break
Here is an example of how to enter with a trend line break:
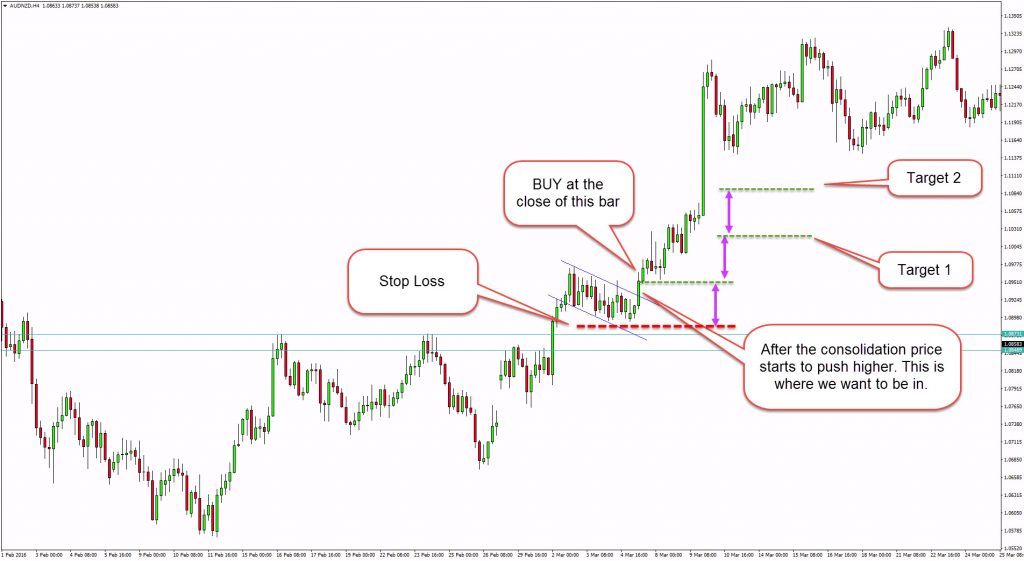
Another option is to go with the break of the last high/low created.
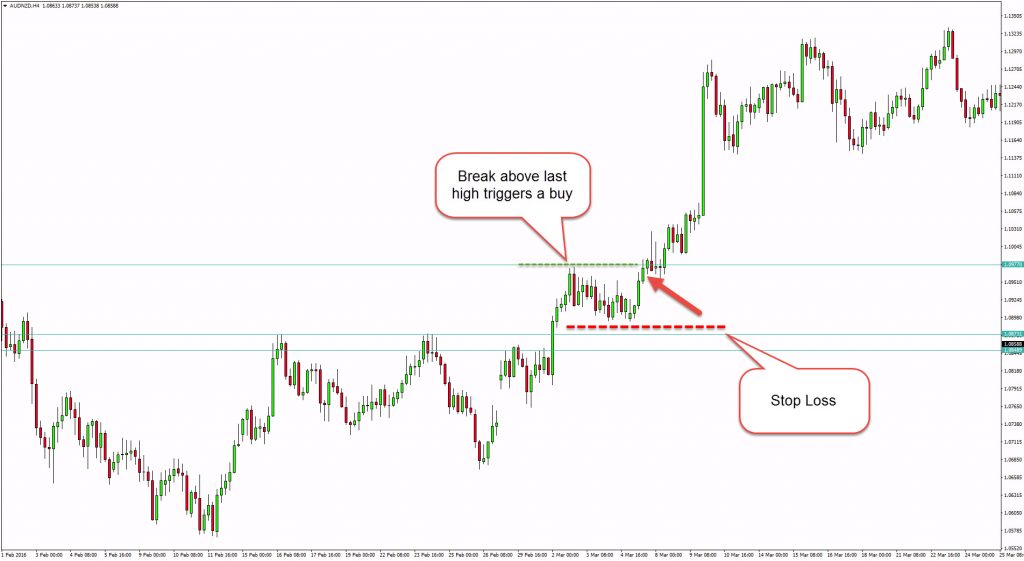
It is pretty simple and powerful because everybody is looking at this levels. Psychology pushes the market in accordance to these patterns. Either breaking the zones or bouncing from them. Of course don’t expect to get 100% success. But this is why we have money management and risk:reward.
Additions
You can use the S/R zones in addition with anything really. However my first choices are Fibonacci Tools, Trend Lines and Divergences. They suit my trading style it work for me.
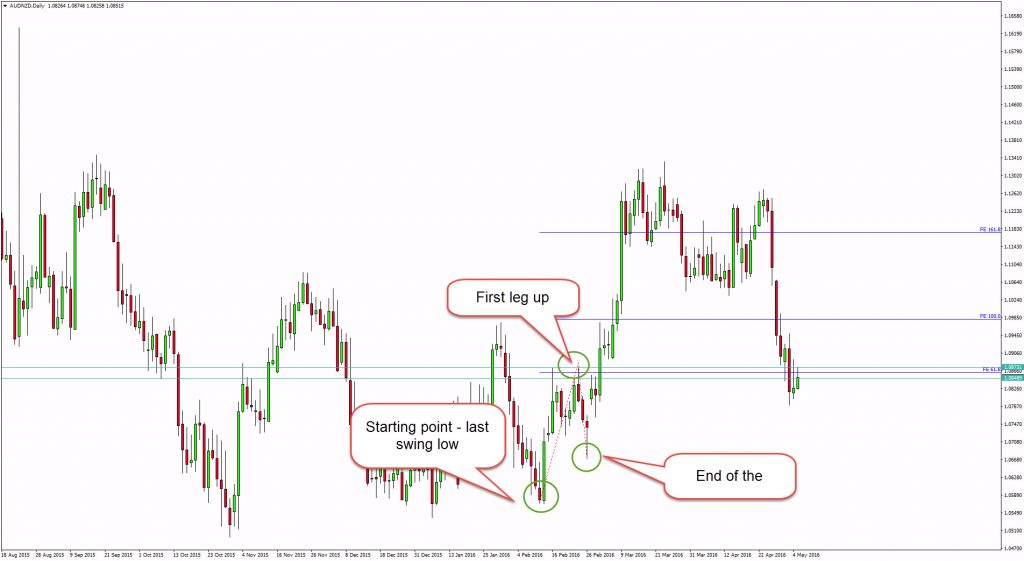
Here is an example of how you can look for potential targets using the Fibonacci Expansion Tool. I would go to H4 or D1 chart and look for the last swing low in this situation and project my levels from there.
To plot the Fibo tool start from the last swing, second point is the first leg up and end at the end of the correction. Now after the breakout you can aim the 100% and 161.8% as targets.
One more example this time using trend line. Price broke below last support and turned into a resistance after it was tested and price rejected the level (confirmation of the breakout). I would place my buy order below the last low (after the breakout) and if price continues lower i would enter this trade. In this case it did. It perfectly respected the broken zone and moved down.
However you can determine your target (even if it is only the second target, you can collect partially once price is at 1:1 or 1:2 risk:reward and create a risk free trade) with the break of the line. Hold your position until the trend line is broken and than close. At this point if the break of the trend line is confirmed you can look for entries in the opposite direction using this strategy.
This method will occasionally give you amazing Risk:Reward Trades. Sometimes 1:5 or even more. You are riding the trend. Trending pairs like GBPAUD, EURAUD, GBPNZD tend to follow and respect trend lines for long time especially if you look to trade the higher TF trend lines like W1 and D1.
That would be all! I hope that you will find this article helpful. The basics are basics for a reason! They work! That’s why tho world is using them.
If you like the article please share it and don’t forget to give me you inputs below in the comment section. I will be glad to see other interesting applications of Support-Resistance zones with additional tools.
Yours,
Vladimir


Hello,
Would you be able to do review my trading and help to pinpoint areas for improvement?
Hi Kaatrin
If you are inside my club, the traders academy club, then yes.
Best regards