Hi Traders! Litecoin short term forecast and technical analysis is here. We do our analysis on the MetaTrader4 platform (MT4), some very interesting, useful tips and hacks about the MT4 platform could be found here. If you would like to learn more about the way we trade and the technical analysis we use then check out the Home Trader Club Spoiler alert – free memberships are available!
Want to access the tools, systems, and real-time education we use daily?
With AvaTrade Broker’s support, you can now enjoy up to one full year of access to the Home Trader Club — including:
All professional trading systems
Access to our new project, the Home Trader Club trade copier, where our traders trade and you can copy.
Real-time trade ideas and setups
Full access to our course library and trading marketplace
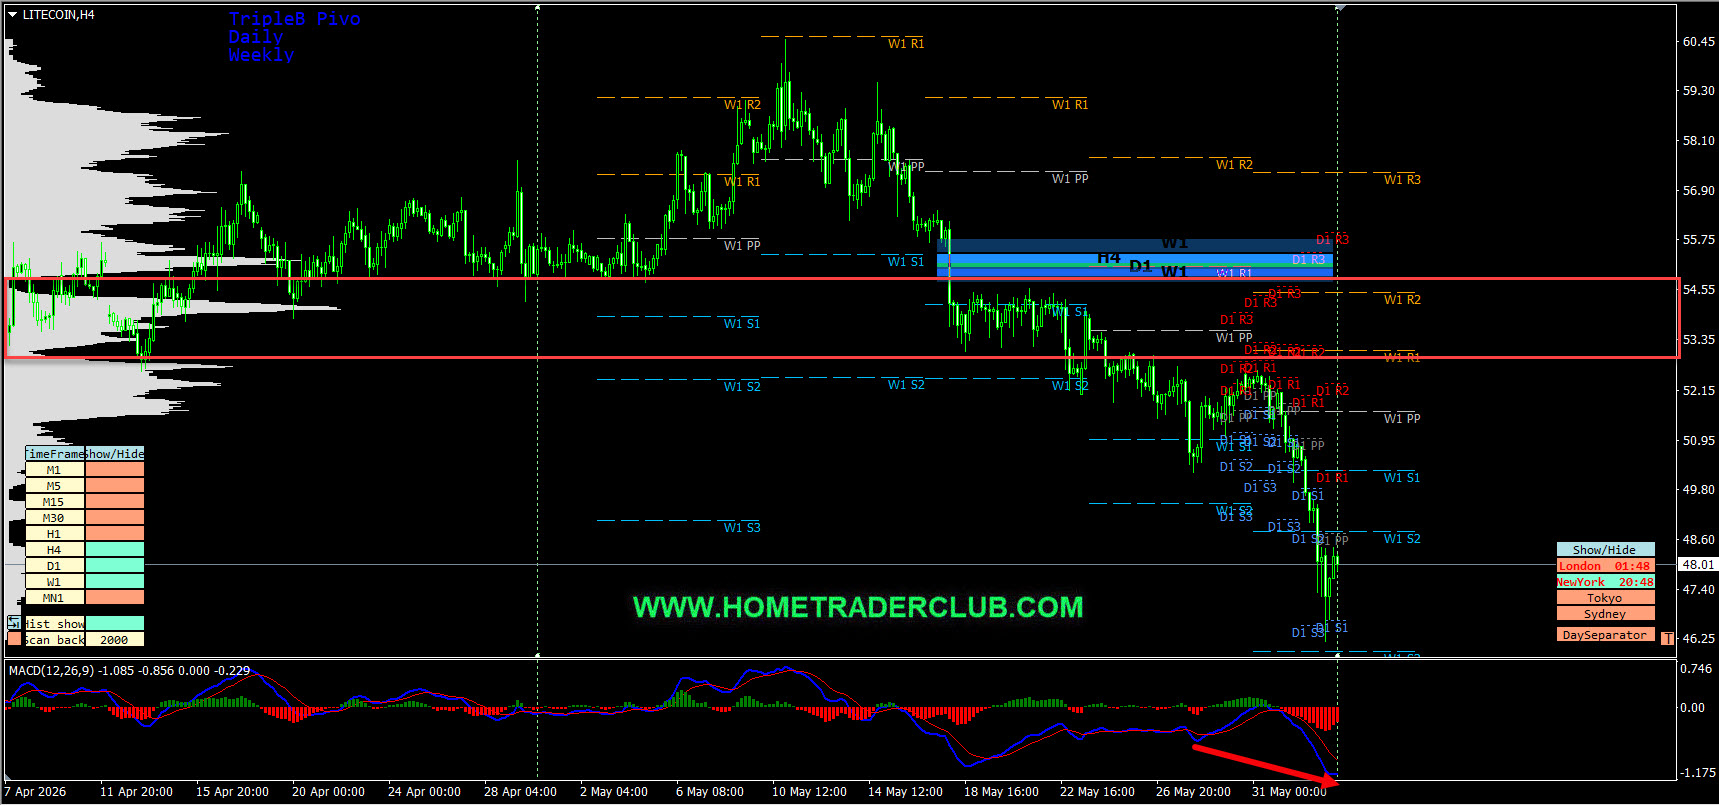
On the H4 chart, we could see that the price which is moving lower has broken below a strong support zone formed based on the volume profile zones of the KTLI indicator and the Triple B Pro pivot levels which we may consider as evidence of bearish pressure. In addition to this, the price which is moving lower has created lower lows based on the MACD indicator, which we may consider as yet another evidence of bearish pressure. Also, currently there are no signs opposing this short term bearish view. We may now move down to lower timeframe and see if we can find evidences supporting this short term bearish view.
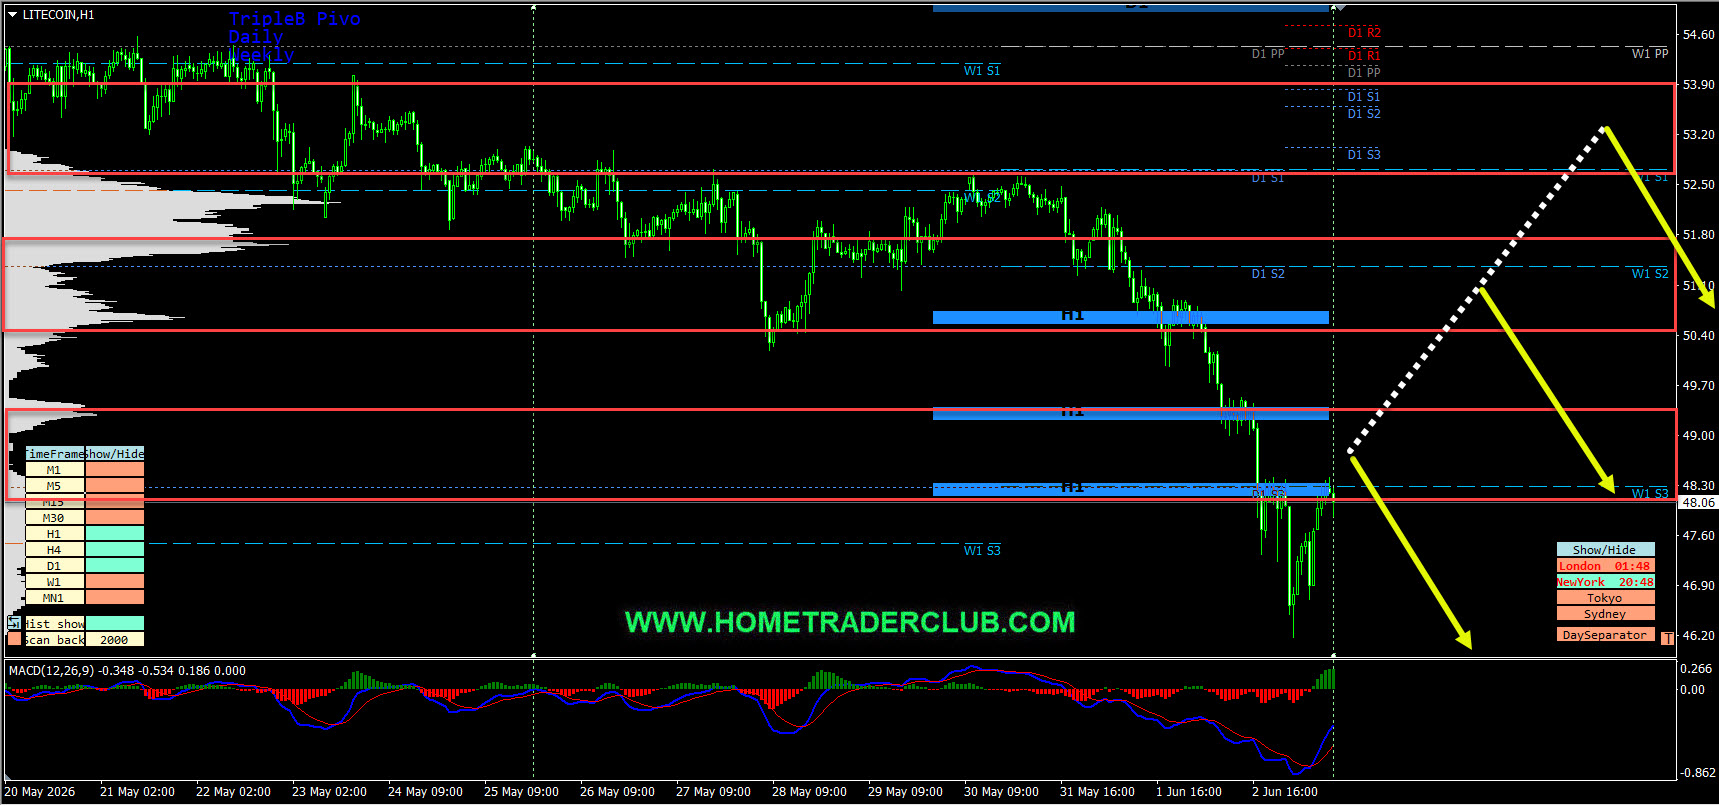
On the H1 chart, we have a strong bearish momentum and also currently there are no signs opposing this short term bearish view. So everything looks good for the bears here as well. In addition to this, we have three key resistance zones that has formed based on the volume profile zones of the KTLI indicator and the Triple B Pro pivot levels. Until these three key resistance zones shown in the image below (marked in red) holds my short term view remains bearish here and I expect the price to move lower further after retraces.
Litecoin H4(4 Hours) Chart Analysis
Litecoin H1(1 Hour) Chart Analysis
It is always recommended to look for confirmations before you jump into any trade. If you are not sure about how to trade this short-term sell setup then you can use any setup and strategy that you have in your arsenal to look for bearish moves and join this sell trade.
Also, don’t forget to protect your sell trade using a stop loss and make sure to set a target and keep a proper risk/reward ratio.
You will also find a pretty extensive database of educational materials here in the blog – just use the search or check out the Forex Education section above.
Not sure how to enter a trade? Spot reversals (bounces)? Not sure how to spot breakouts?
I invite you to
And improve your trading with us.
Also, you can get one of our strategies free of charge. You will find all the details here
Download our best forex indicators here
If you have any further questions, don’t hesitate to drop a comment below!
Happy Trading!
Arvinth Akash
Home Trader Club Team.
European markets edged lower on Thursday following more overnight volatility in Asia’s tech-dominated indexes, while…
Hi Traders! EURGBP short term forecast and technical analysis is here. We do our analysis…
Hi Traders! Bitcoin short term forecast update and follow up is here. On May 7th,…
Hi Traders! AUDJPY short term forecast and technical analysis is here. We do our analysis…
Hi Traders! Oil short term forecast and technical analysis is here. We do our analysis…
The new trading week presents several high-probability opportunities across the forex and commodities markets. After…